Bridge Technologies May Blog Post
May 26, 2019
Graphics: making the complex simple
Simen K Frostad (Chairman – Bridge Technologies)
The oldest known maps date back over 4,000 years, with the first map of the world produced in the 16th century. Today, we take them for granted (although satellite navigation systems have perhaps rendered the reading of maps a forgotten skill…). Obviously, a map looks nothing like what it represents. Maps work wonderfully well because they are a simple graphical representation of often complex data.
The London Tube map is especially famous. The first maps of the London Underground sought to reflect the reality of where the train lines actually ran and where the stations really were in relation to each other – they were geographically accurate (more or less) representations. They were also complex and almost impossible to interpret – reducing their value to travellers.

Remarkable achievement
It was in 1931 that a draughtsman called Harry Beck created the Tube map we know today. It almost couldn’t be less geographically accurate: the scale bears no relationship to reality; the distance between each station is approximately the same: the train tracks run (mostly) in straight lines. But what Beck achieved was remarkable: it presents a phenomenal amount of information – yet even a novice traveller can quickly and easily work out what he needs to do to get to his destination. To all intents and purpose, Beck’s map is still in use today – almost 80 years later – by millions of London Underground passengers. By making the complex simple, through the use of advanced graphics, Beck’s work was transformative.
Perhaps no less transformative was the work done at Xerox PARC (Palo Alto Research Center) in the early 1970s. In 1981, Xerox introduced a pioneering product – the Star workstation. Why was it pioneering? It was the first computer to feature a graphical user interface (GUI). The Star itself was not a commercial success – but without Xerox’s development of the GUI, Apple and Microsoft Windows might never have existed. By 1982, Apple had released the Lisa and Macintosh. In 1985, Microsoft announced a ‘shell’ for MS-DOS in response to the growing interest in GUIs – which, in effect, became Windows 3.1 in April 1992. The rest, as they say, is history.
Why was the Graphical User Interface so important – so transformative? Before GUIs became popular, command line interface (CLI) systems were how users interacted with computers. Telling the computer what to do involved typing in text (which was often coded) – and the output from the computer was invariably in text form too. Getting anything useful from a computer was often a long, laborious process – and one that needed, in effect, specialist skills (knowing, for example, that to find the contents of a directory, you needed to type ‘dir’, or to check the file system integrity of a disk, you needed to know that the command was ‘chkdsk’). It was certainly far from intuitive.
Making interaction simpler
The beauty of a good GUI is that anyone, with minimal training, can use a computer and be productive with it. A GUI typically includes numerous icons together with other visual indicators – and a simple ‘point and click’ operation to choose what you want the computer to do. It’s all about easing computer/human interaction.
Like the London Underground map: a GUI uses smart graphical representations to make simple what would otherwise be complex and time-consuming – and provides information that, because it is intuitively understood, can be rapidly assimilated and acted upon.
How, though, are the map of the London Underground and the development of the GUI, relevant to media network management?
First: no-one would deny that today’s IP networks are incredibly complex – and that complexity is only growing as we ask more and more of them, and as they evolve to meet new needs. Expressed in numbers, perhaps the best example is the need to move from IPv4 to IPv6, driven by the proliferation of devices requiring to be attached to the network. The total number of possible IPv6 addresses is more than 7.9×1028 times as many as IPv4 – or, if you prefer: IPv4 will support ‘only’ 4,294,967,296 addresses, while IPv6 will support 340,282,366,920,938,463,463,374,607, 431,768,211,456… That’s complexity on a huge scale. IP networks are, in effect, the nervous system of our daily business and social lives. That complexity might be less of an issue if we weren’t wholly dependent on them to deliver what we expect, when we expect it.
Steep learning curve
IPv4 was introduced in 1974 – but IP has only recently begun to establish itself as the networking technology of choice in the broadcast industry. That transition is now well under way as IP’s attractions, benefits and advantages – flexibility, scalability, interoperability, cost-effectiveness – become clear to those involved in the creation and distribution of media. The industry is on a steep learning curve – especially when it comes to managing complex networks.
What are needed are network management tools that demonstrate two vital characteristics. The first is accuracy to the nth degree – capable of operating at the sub-microsecond level in analysing the packet behaviour which is key to understanding the performance of the network. Second is the ability to turn the huge volumes of packet data gathered, and turn it into meaningful information that can be quickly and easily understood and, more importantly, acted upon.
To gather the data, Bridge Technologies provides a range of probes – notably, the VB440 dual 40 Gigabit Ethernet probe, which typically monitors high-bitrate IP media traffic in core broadcasting networks, production studios, outside broadcast and master control centres. It is unique in its ability to support dual 40 Gigabit interfaces – giving it the ability to analyse redundant networks – and in its support of uncompressed media over IP with full ST2110 and ST2022-6.
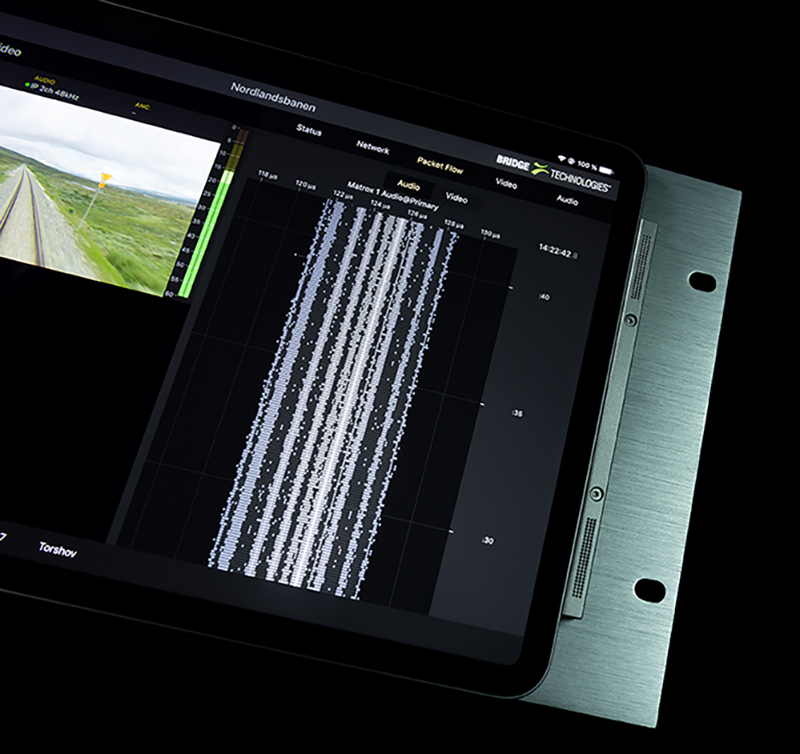
Perhaps more importantly, however: the VB440 can optionally be provided with Instrument View, a unique graphical representation tool in the industry that enables visualisation of the network – much as the traditional vector scope used to, and offering a tool set with which engineers will be familiar, but far more intuitively. Instrument View is a completely new way of viewing the behaviour of uncompressed real time media as it traverses the network. Designed to enable media professionals and others to obtain a highly instinctual view of packet behaviour in an IP environment, it delivers unprecedented accuracy – down to sub-microsecond – and speed.
Providing absolute certainty
Developed by Bridge Technologies specifically for those in media production dealing with high bitrate uncompressed media on ST2110 and ST2022.6 transport formats, Instrument View provides detailed picture, audio and ancillary data, thus providing users with absolute certainty about the performance of the underlying infrastructure. Substantial attention has been given to Instrument View’s highly visual user interface such that the information it delivers can be intuitively understood and acted upon by non-experts.
Instrument View’s typical uses include outside broadcast/remote production environments, where it allows the production team to ‘see’ the movement of uncompressed media content in real time and to ensure it meets the highest standards in video and audio. In a mixed HDR/non-HDR environment, for instance, it can be used to assure optimum colorimetry. Audio – synched to video – can be both ‘seen’ and heard to assure perfect sound quality. It is compatible with any digital video/audio combination from SD through HD to UHD.
Graphical representations of important information are commonplace in our everyday lives because they present that important information in a way that’s readily and quickly understood – in many cases, so that action can be taken more rapidly. Instrument View’s ability to provide an invaluable visualisation tool does precisely that. As with the tube map and Windows: it’s all about making the complex simple.