

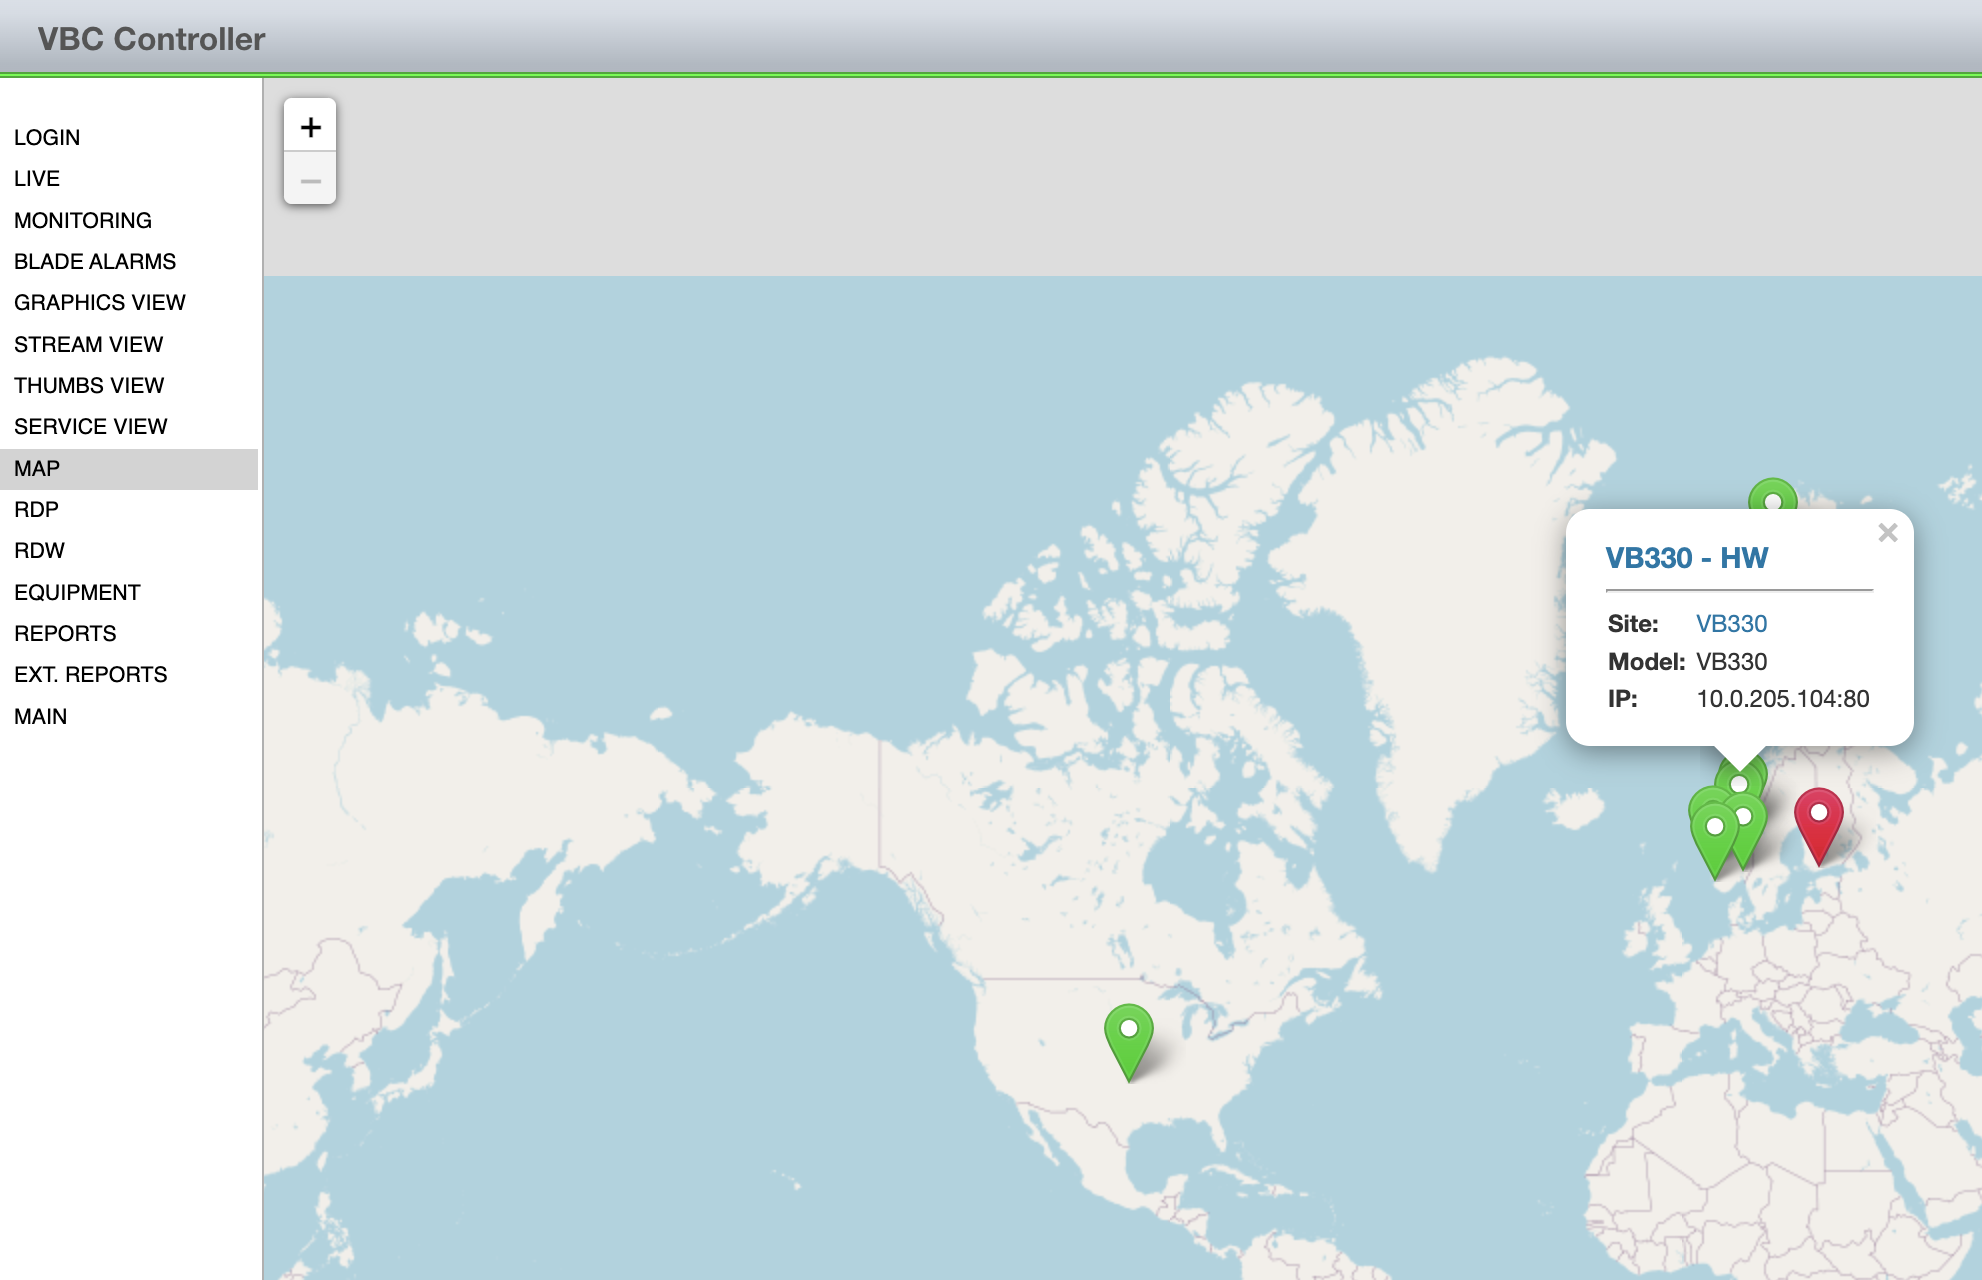


Centralized management
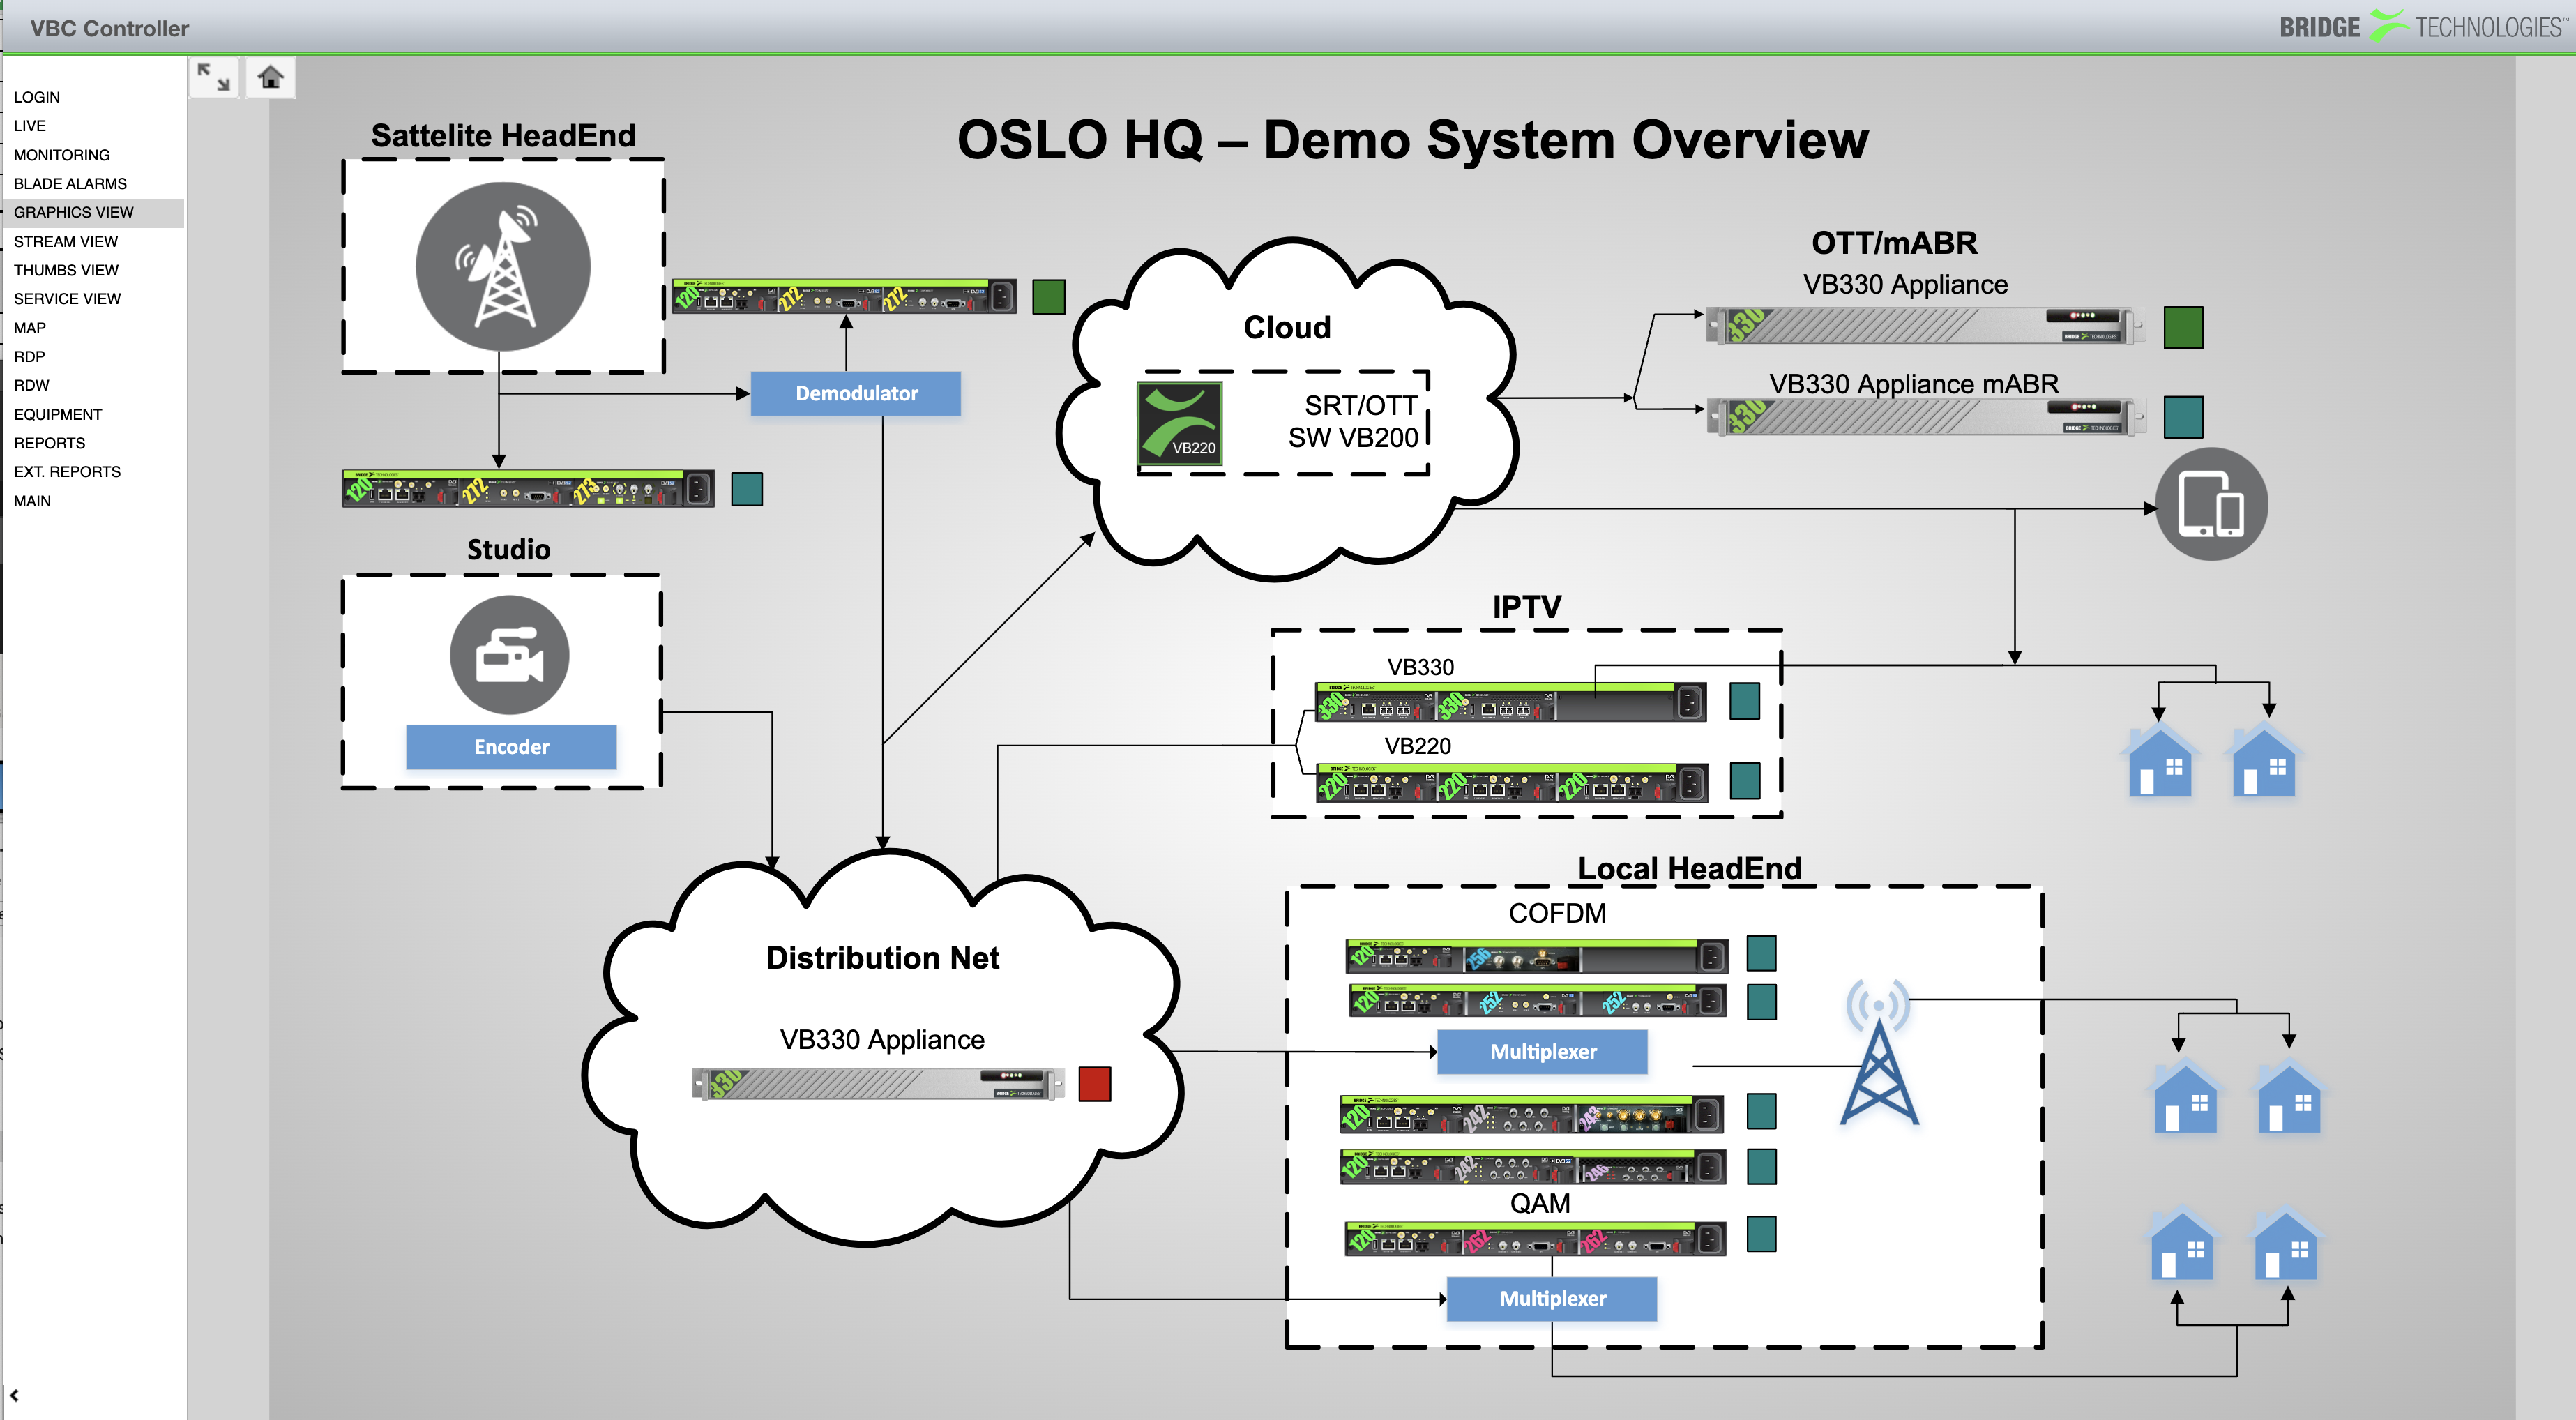
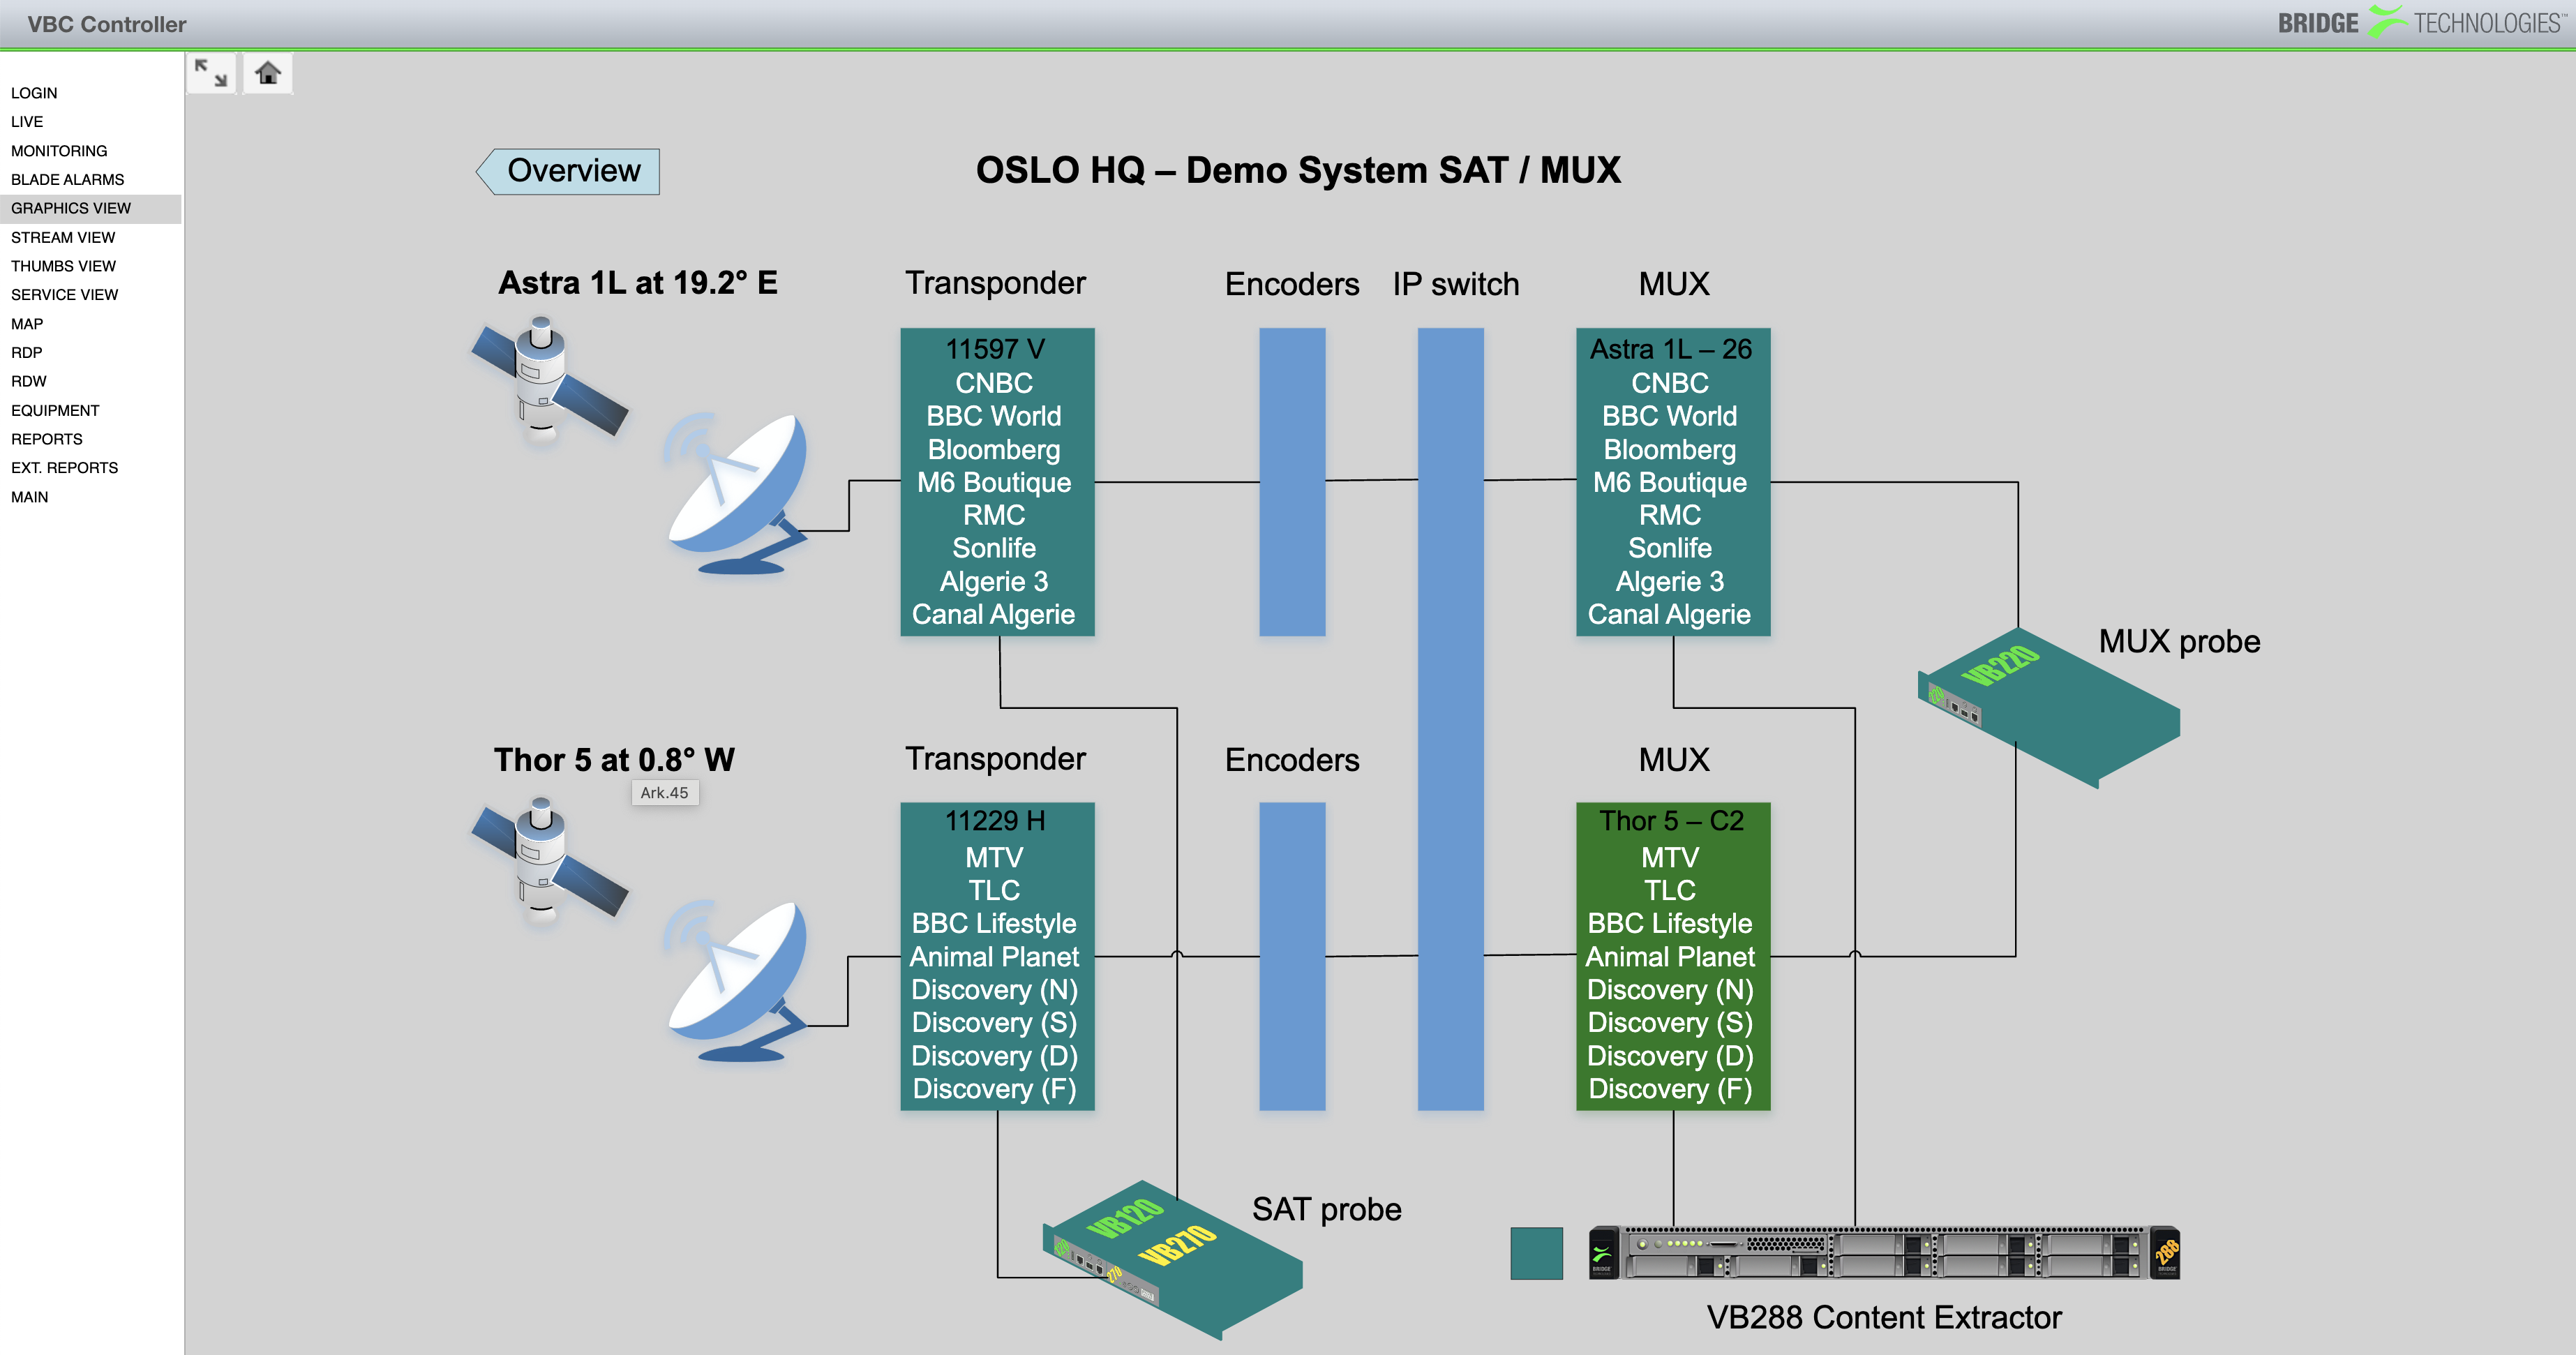
- Centralized management of all Bridge Technologies Probes (IP multicast, SRT, Satellite, Cable. Terrestrial, OTT, L2TP, mABR)
- Scalable architecture supporting up to 500 monitoring probes through licensing
- Centralized bulk software upgrade capabilities
- Hierarchical equipment views with bulk‑edit functionality
- Configuration file copy/paste between probes
- User‑based login for web‑browser clients
- Configurable access control with support for multiple user roles
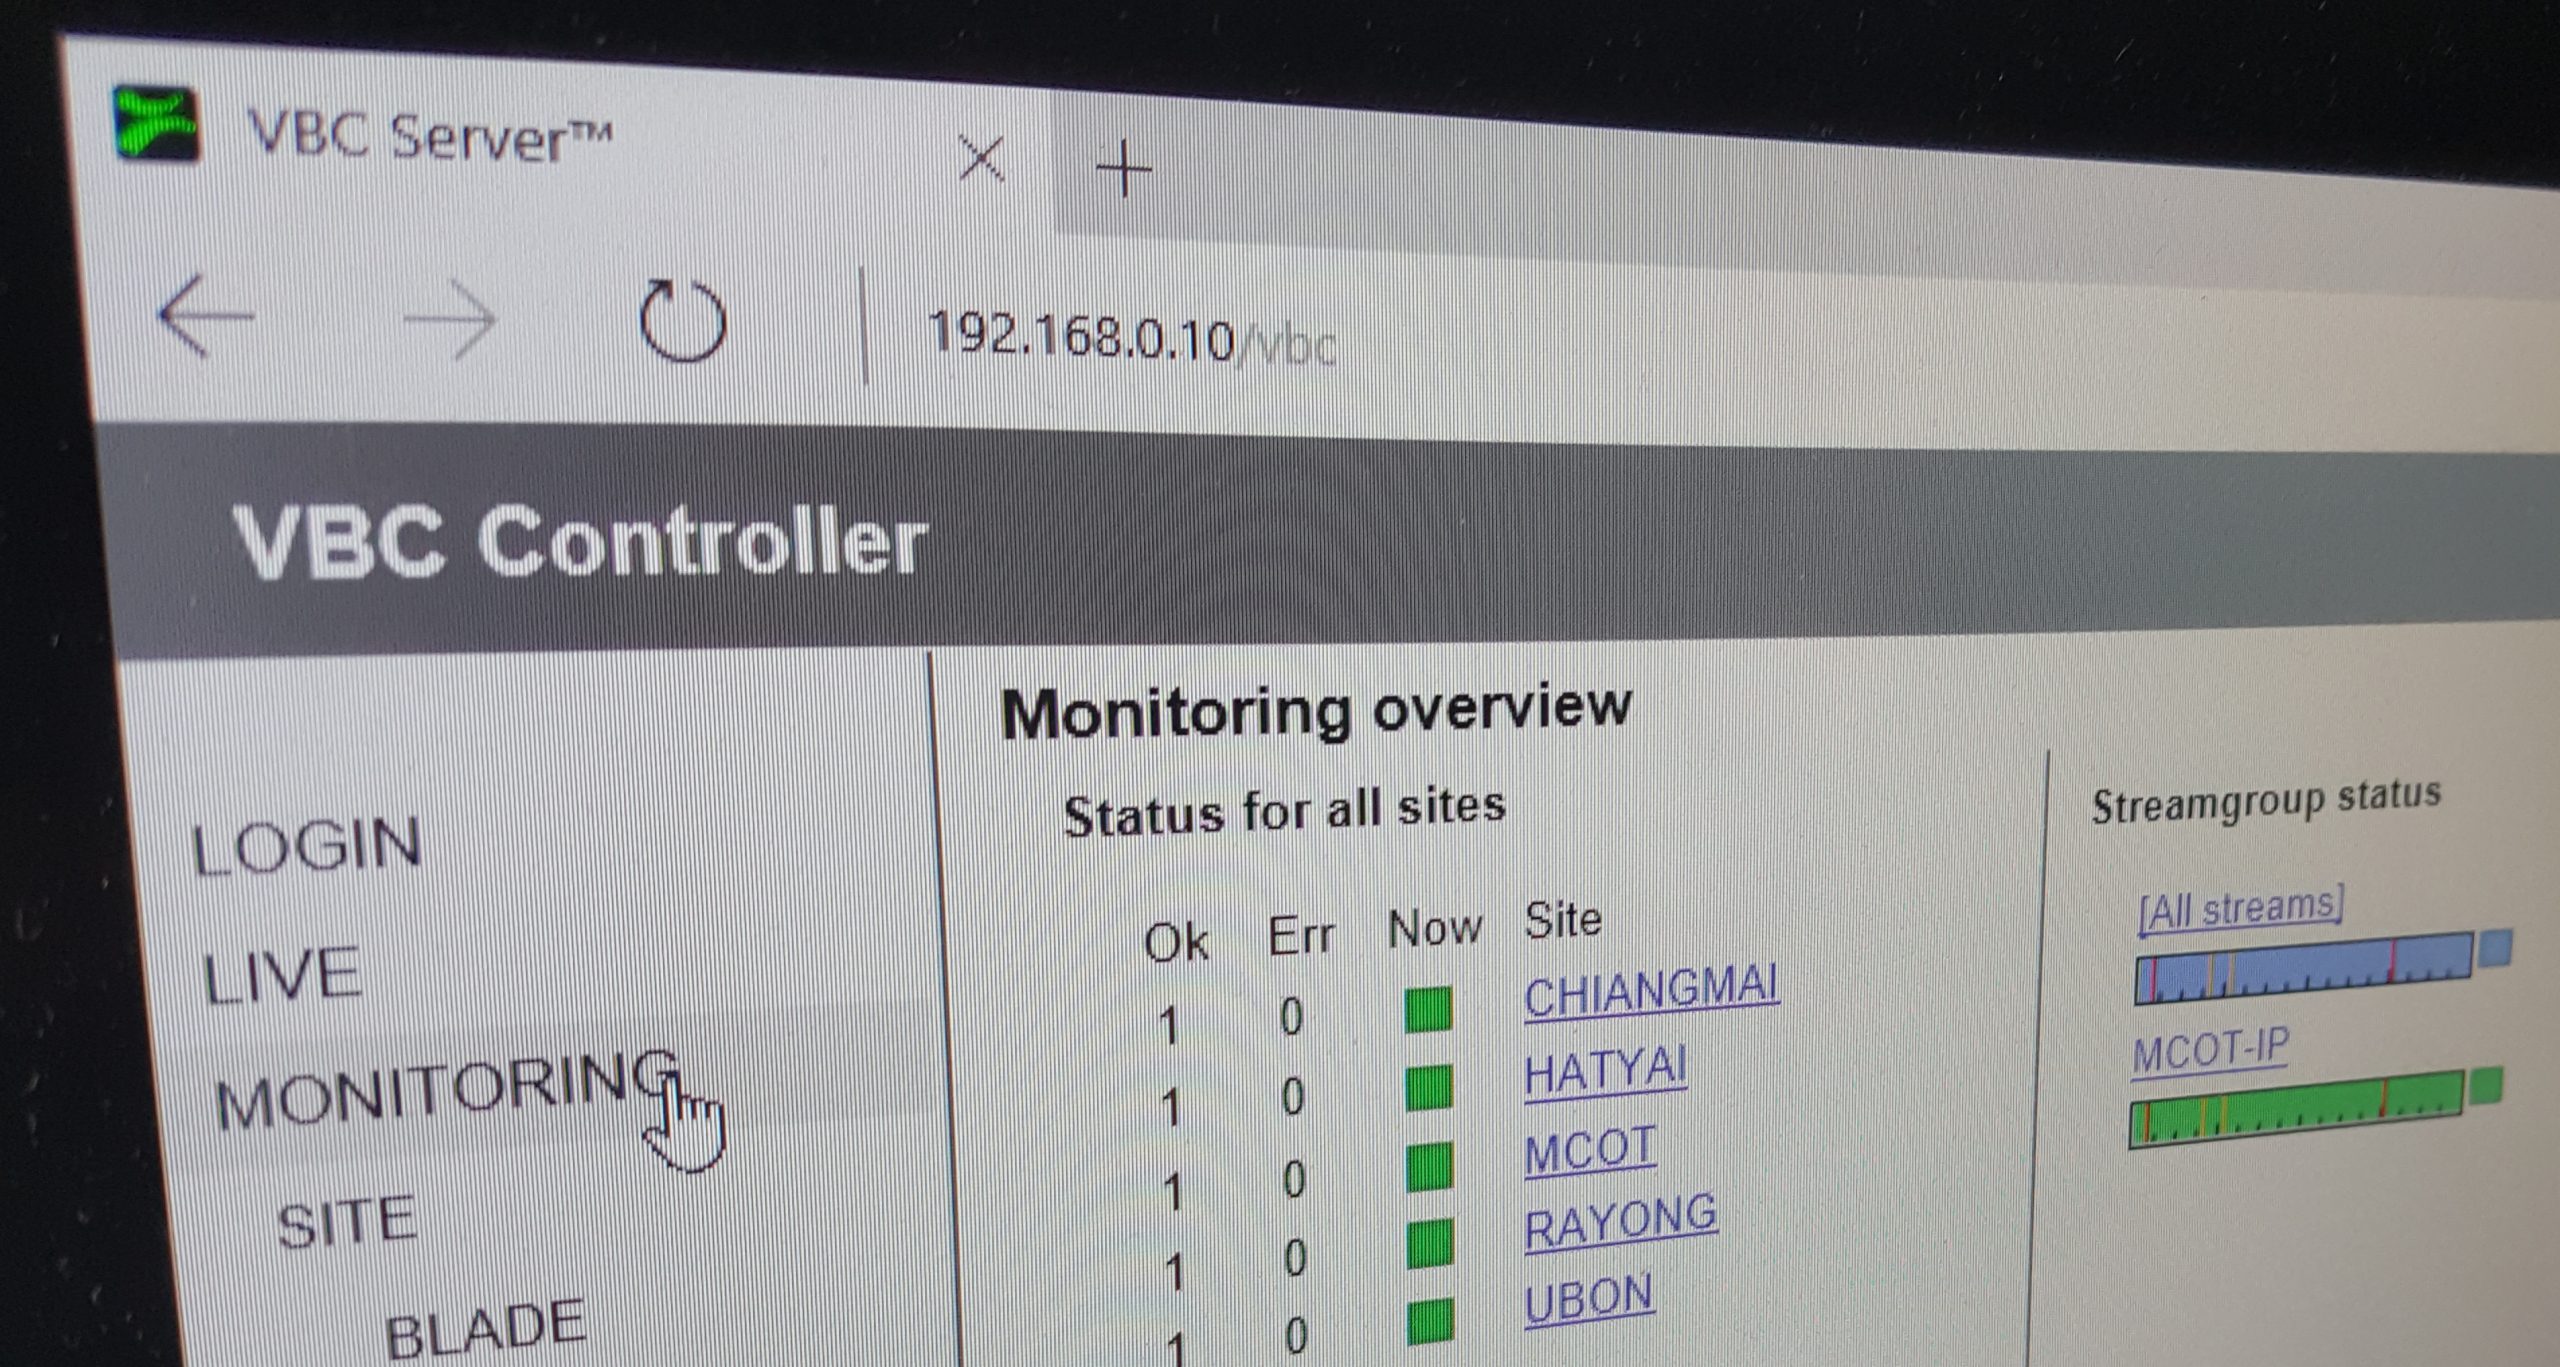
- System‑wide health status overview panel
- License based
Centralized monitoring
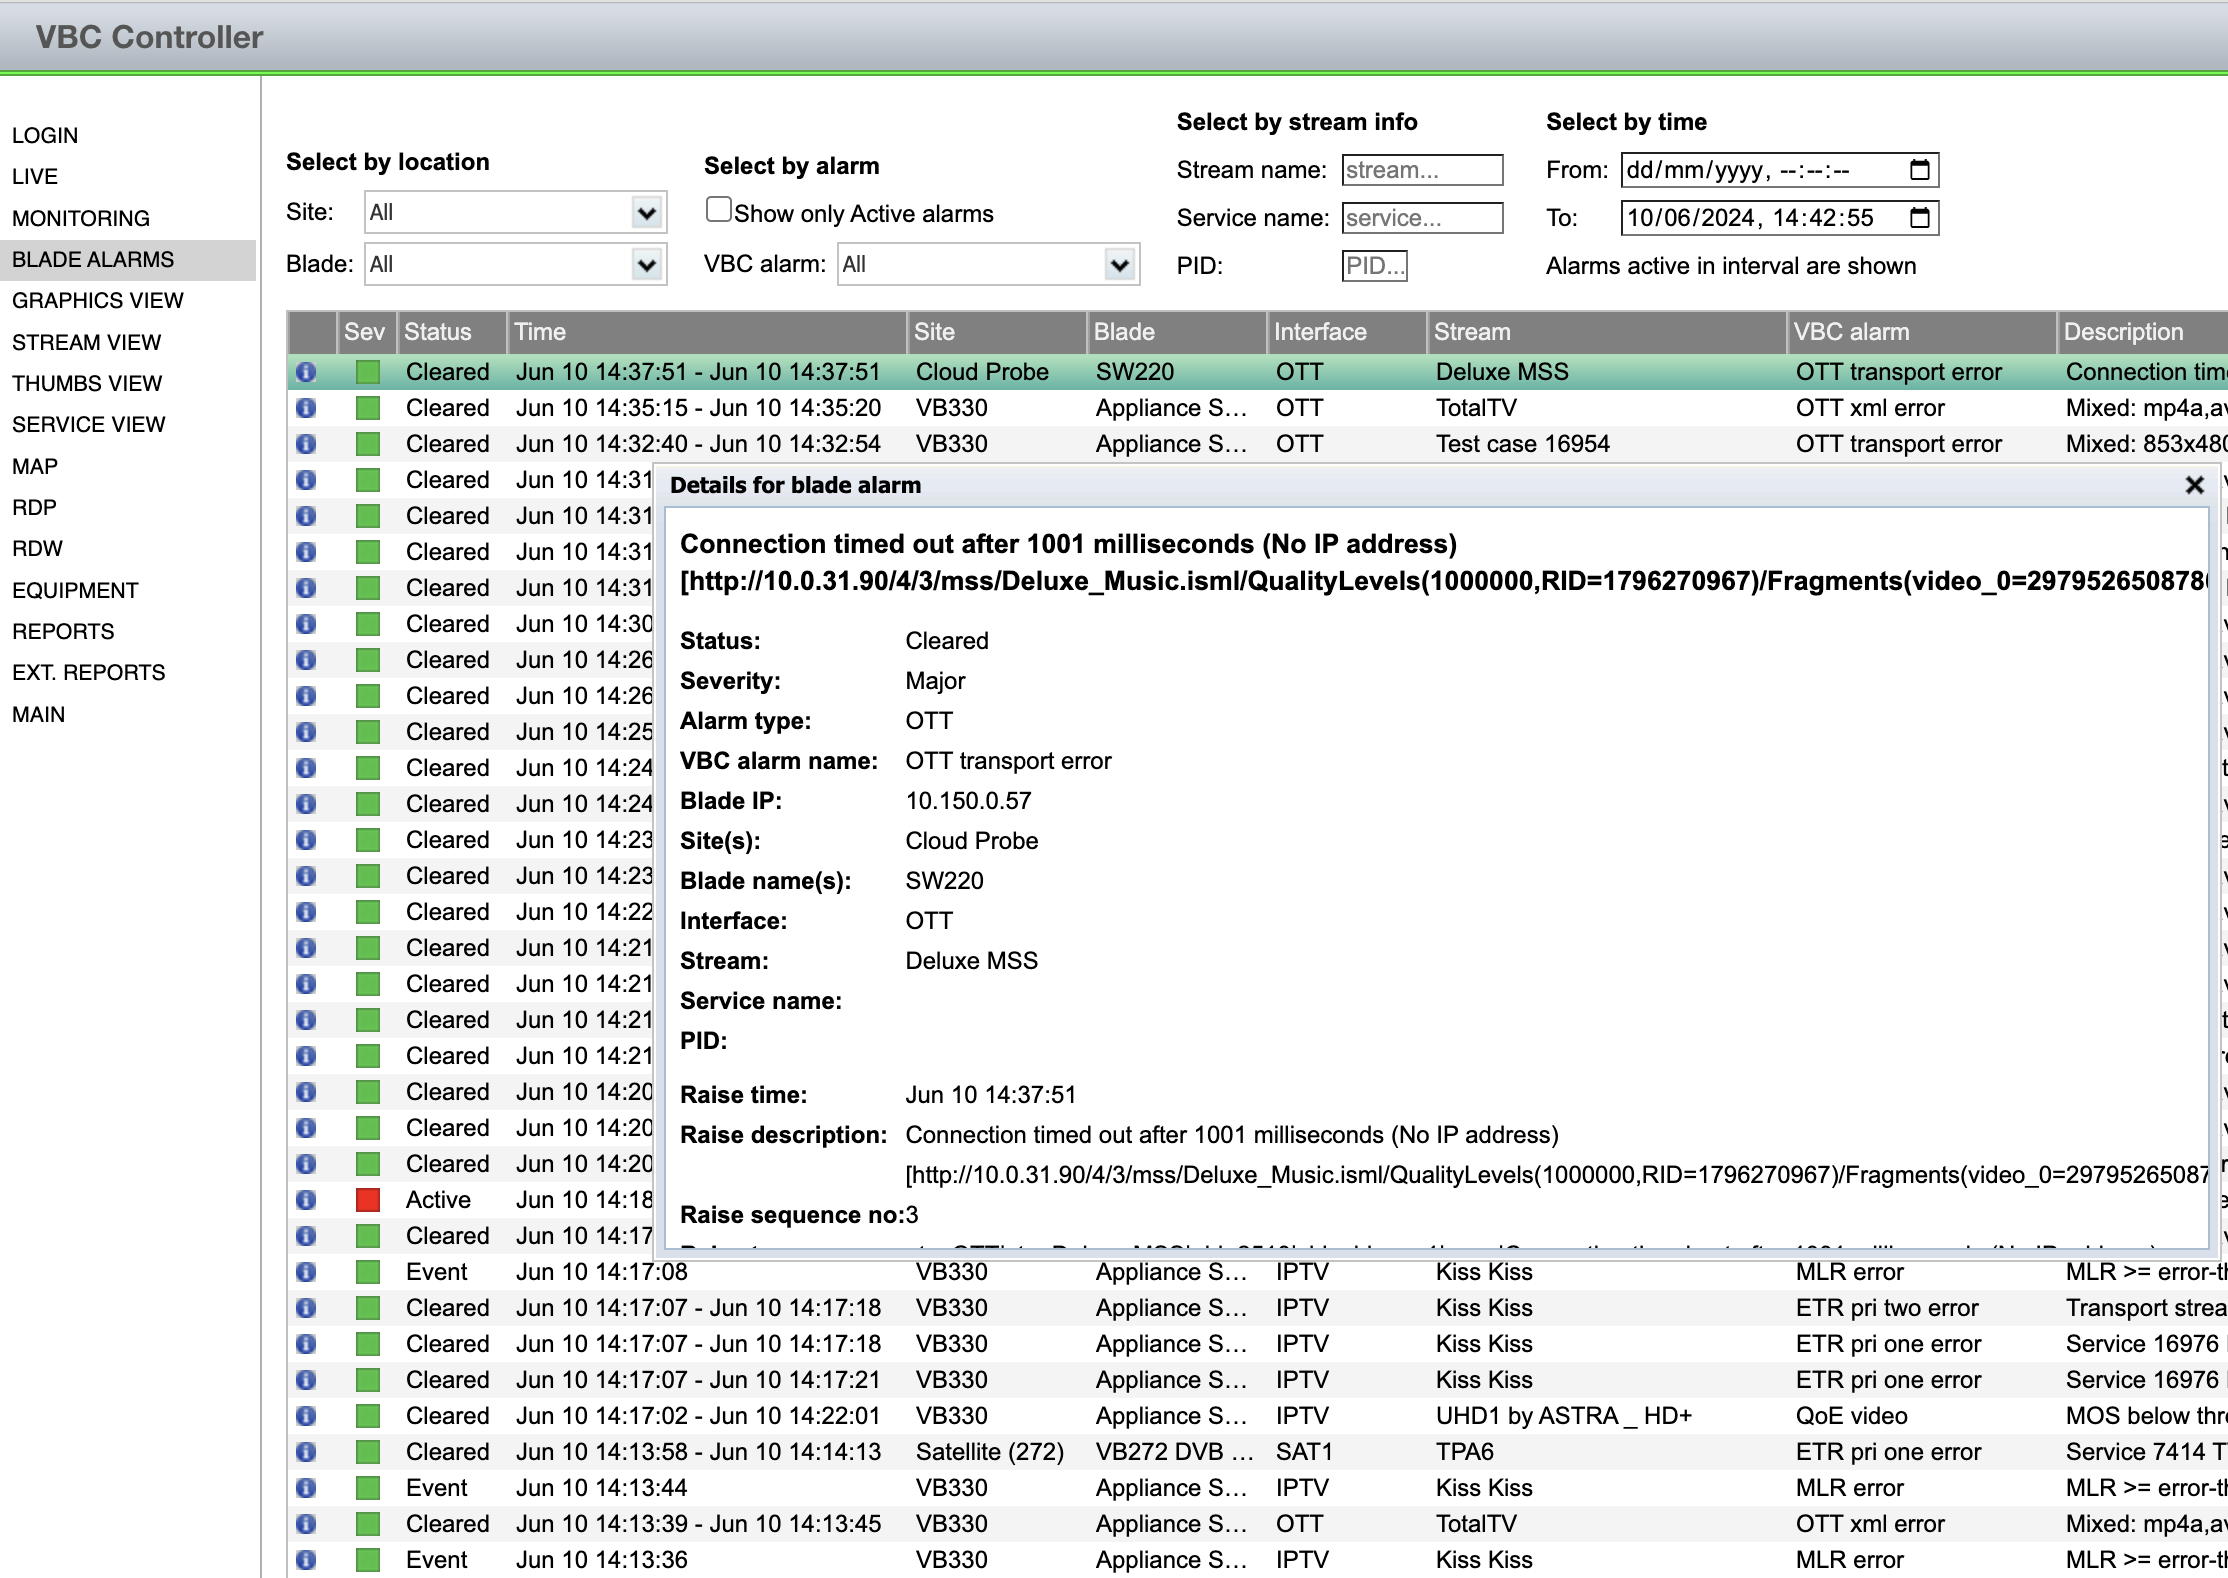
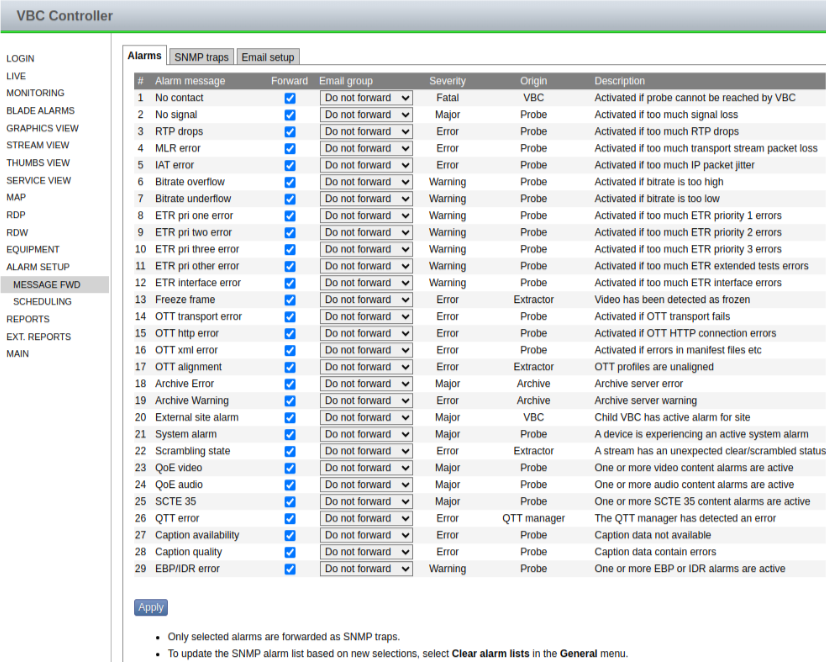
- List of active and cleared alarms present on each device
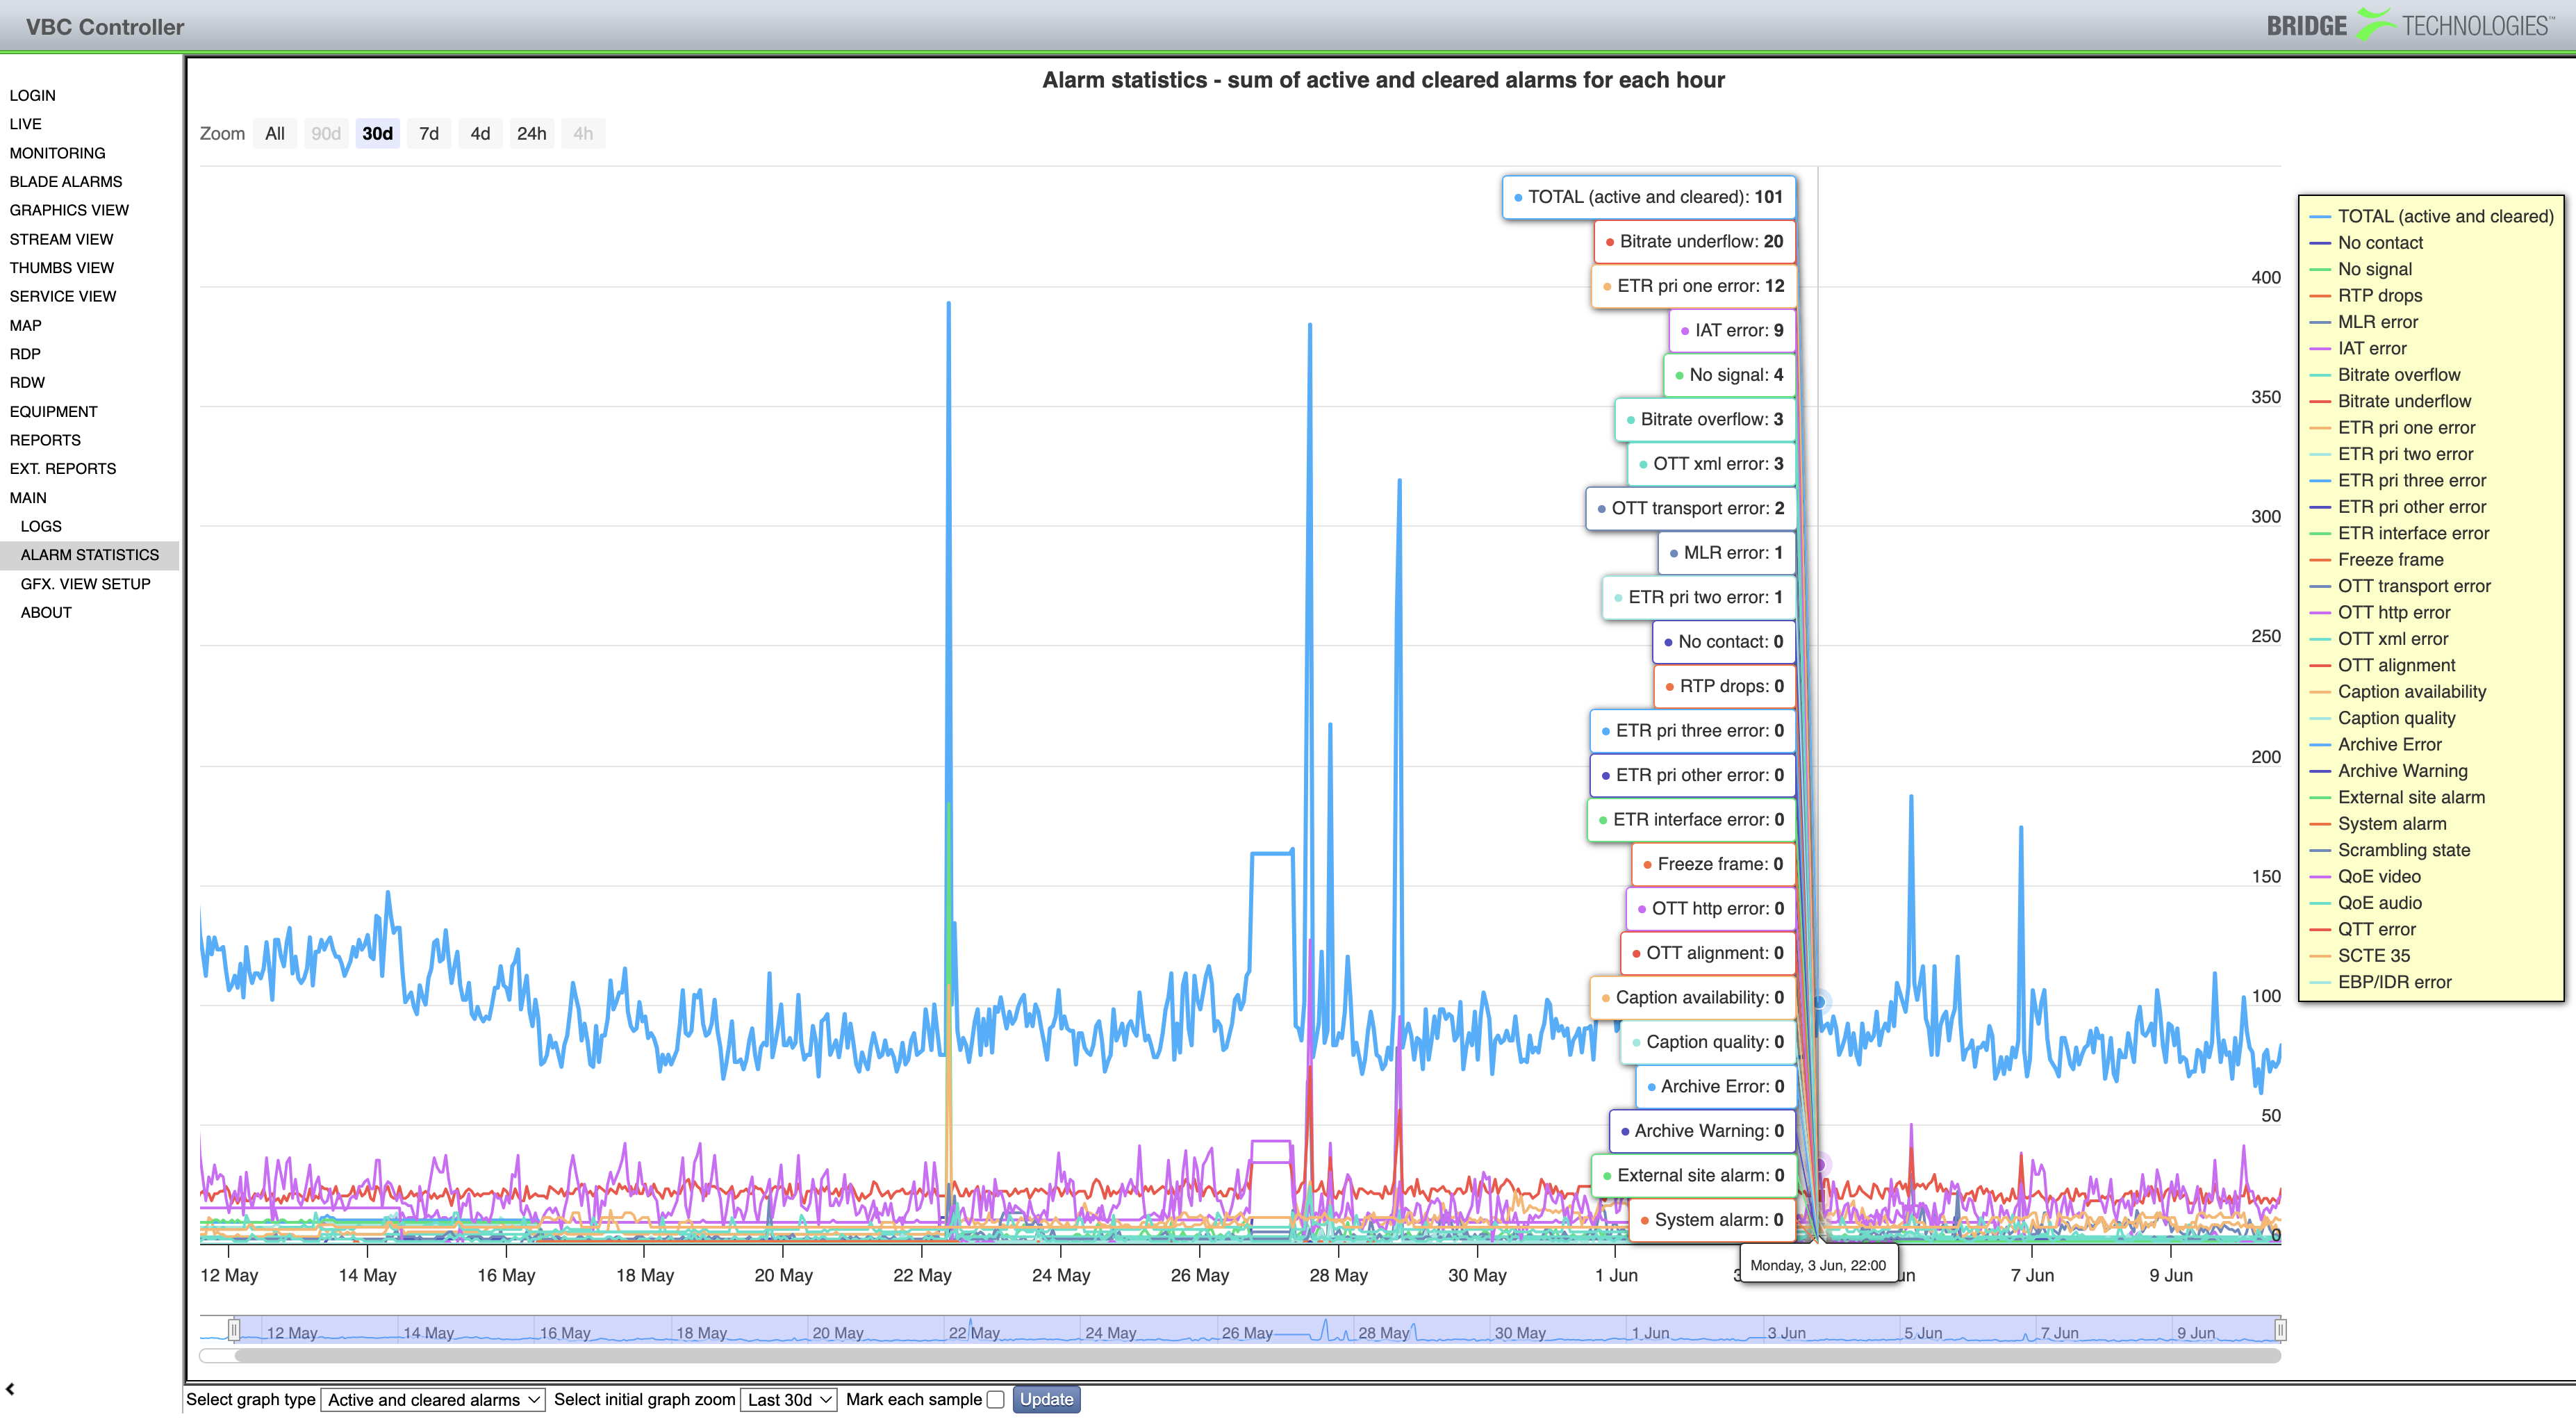
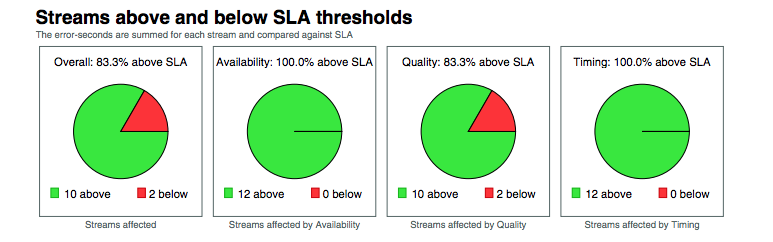
- List of active VBC alarms across all sites based on error seconds
- User configurable severity levels, colors, and filters.
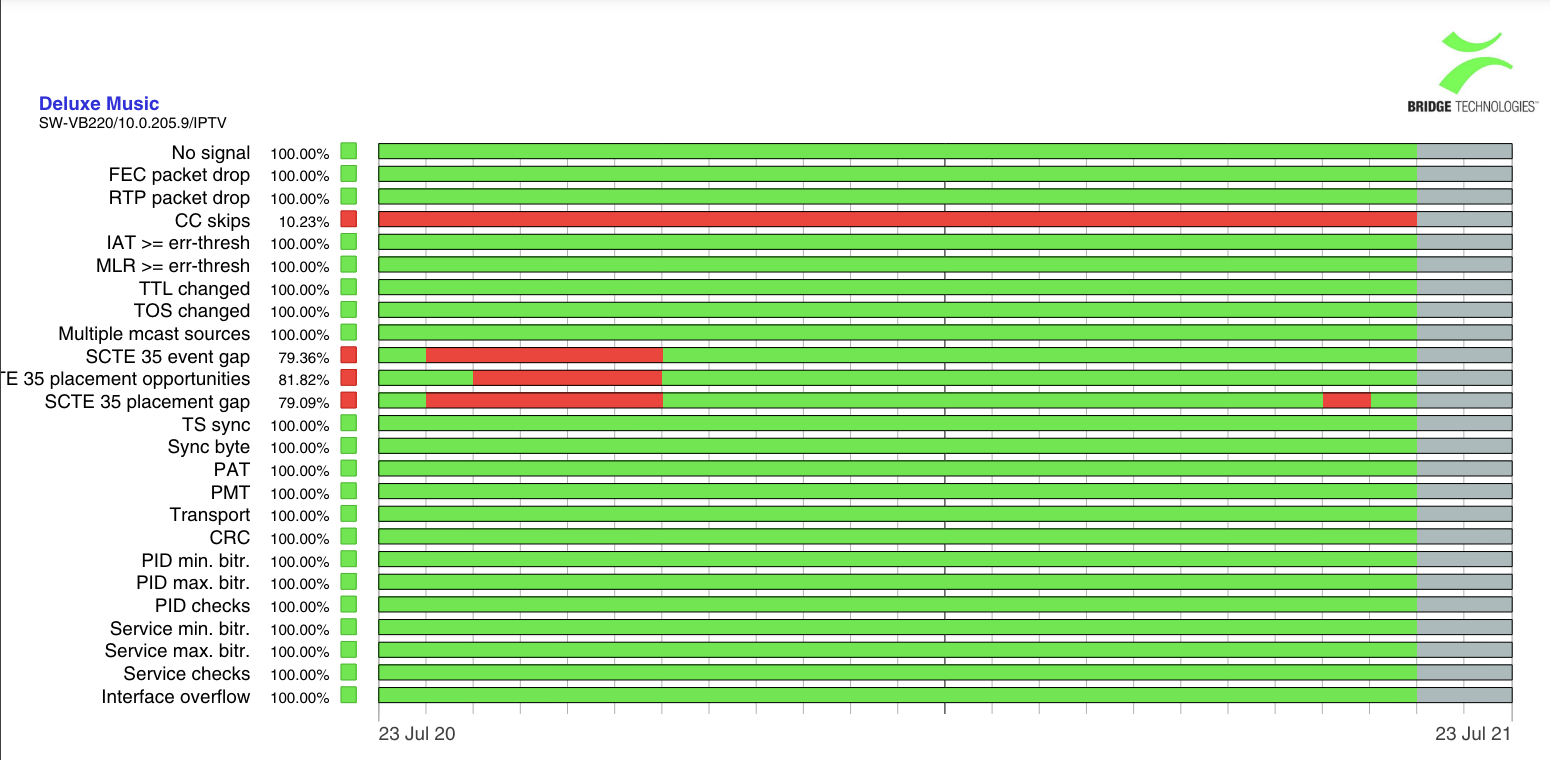
- Graphical Transport Stream aggregated alarm view for several day
- Monitoring of overall system status at-a-glance
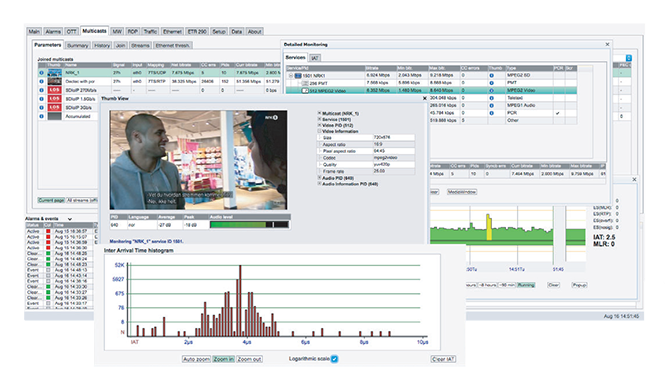
- Drill-down functionality to examine details on the devices.
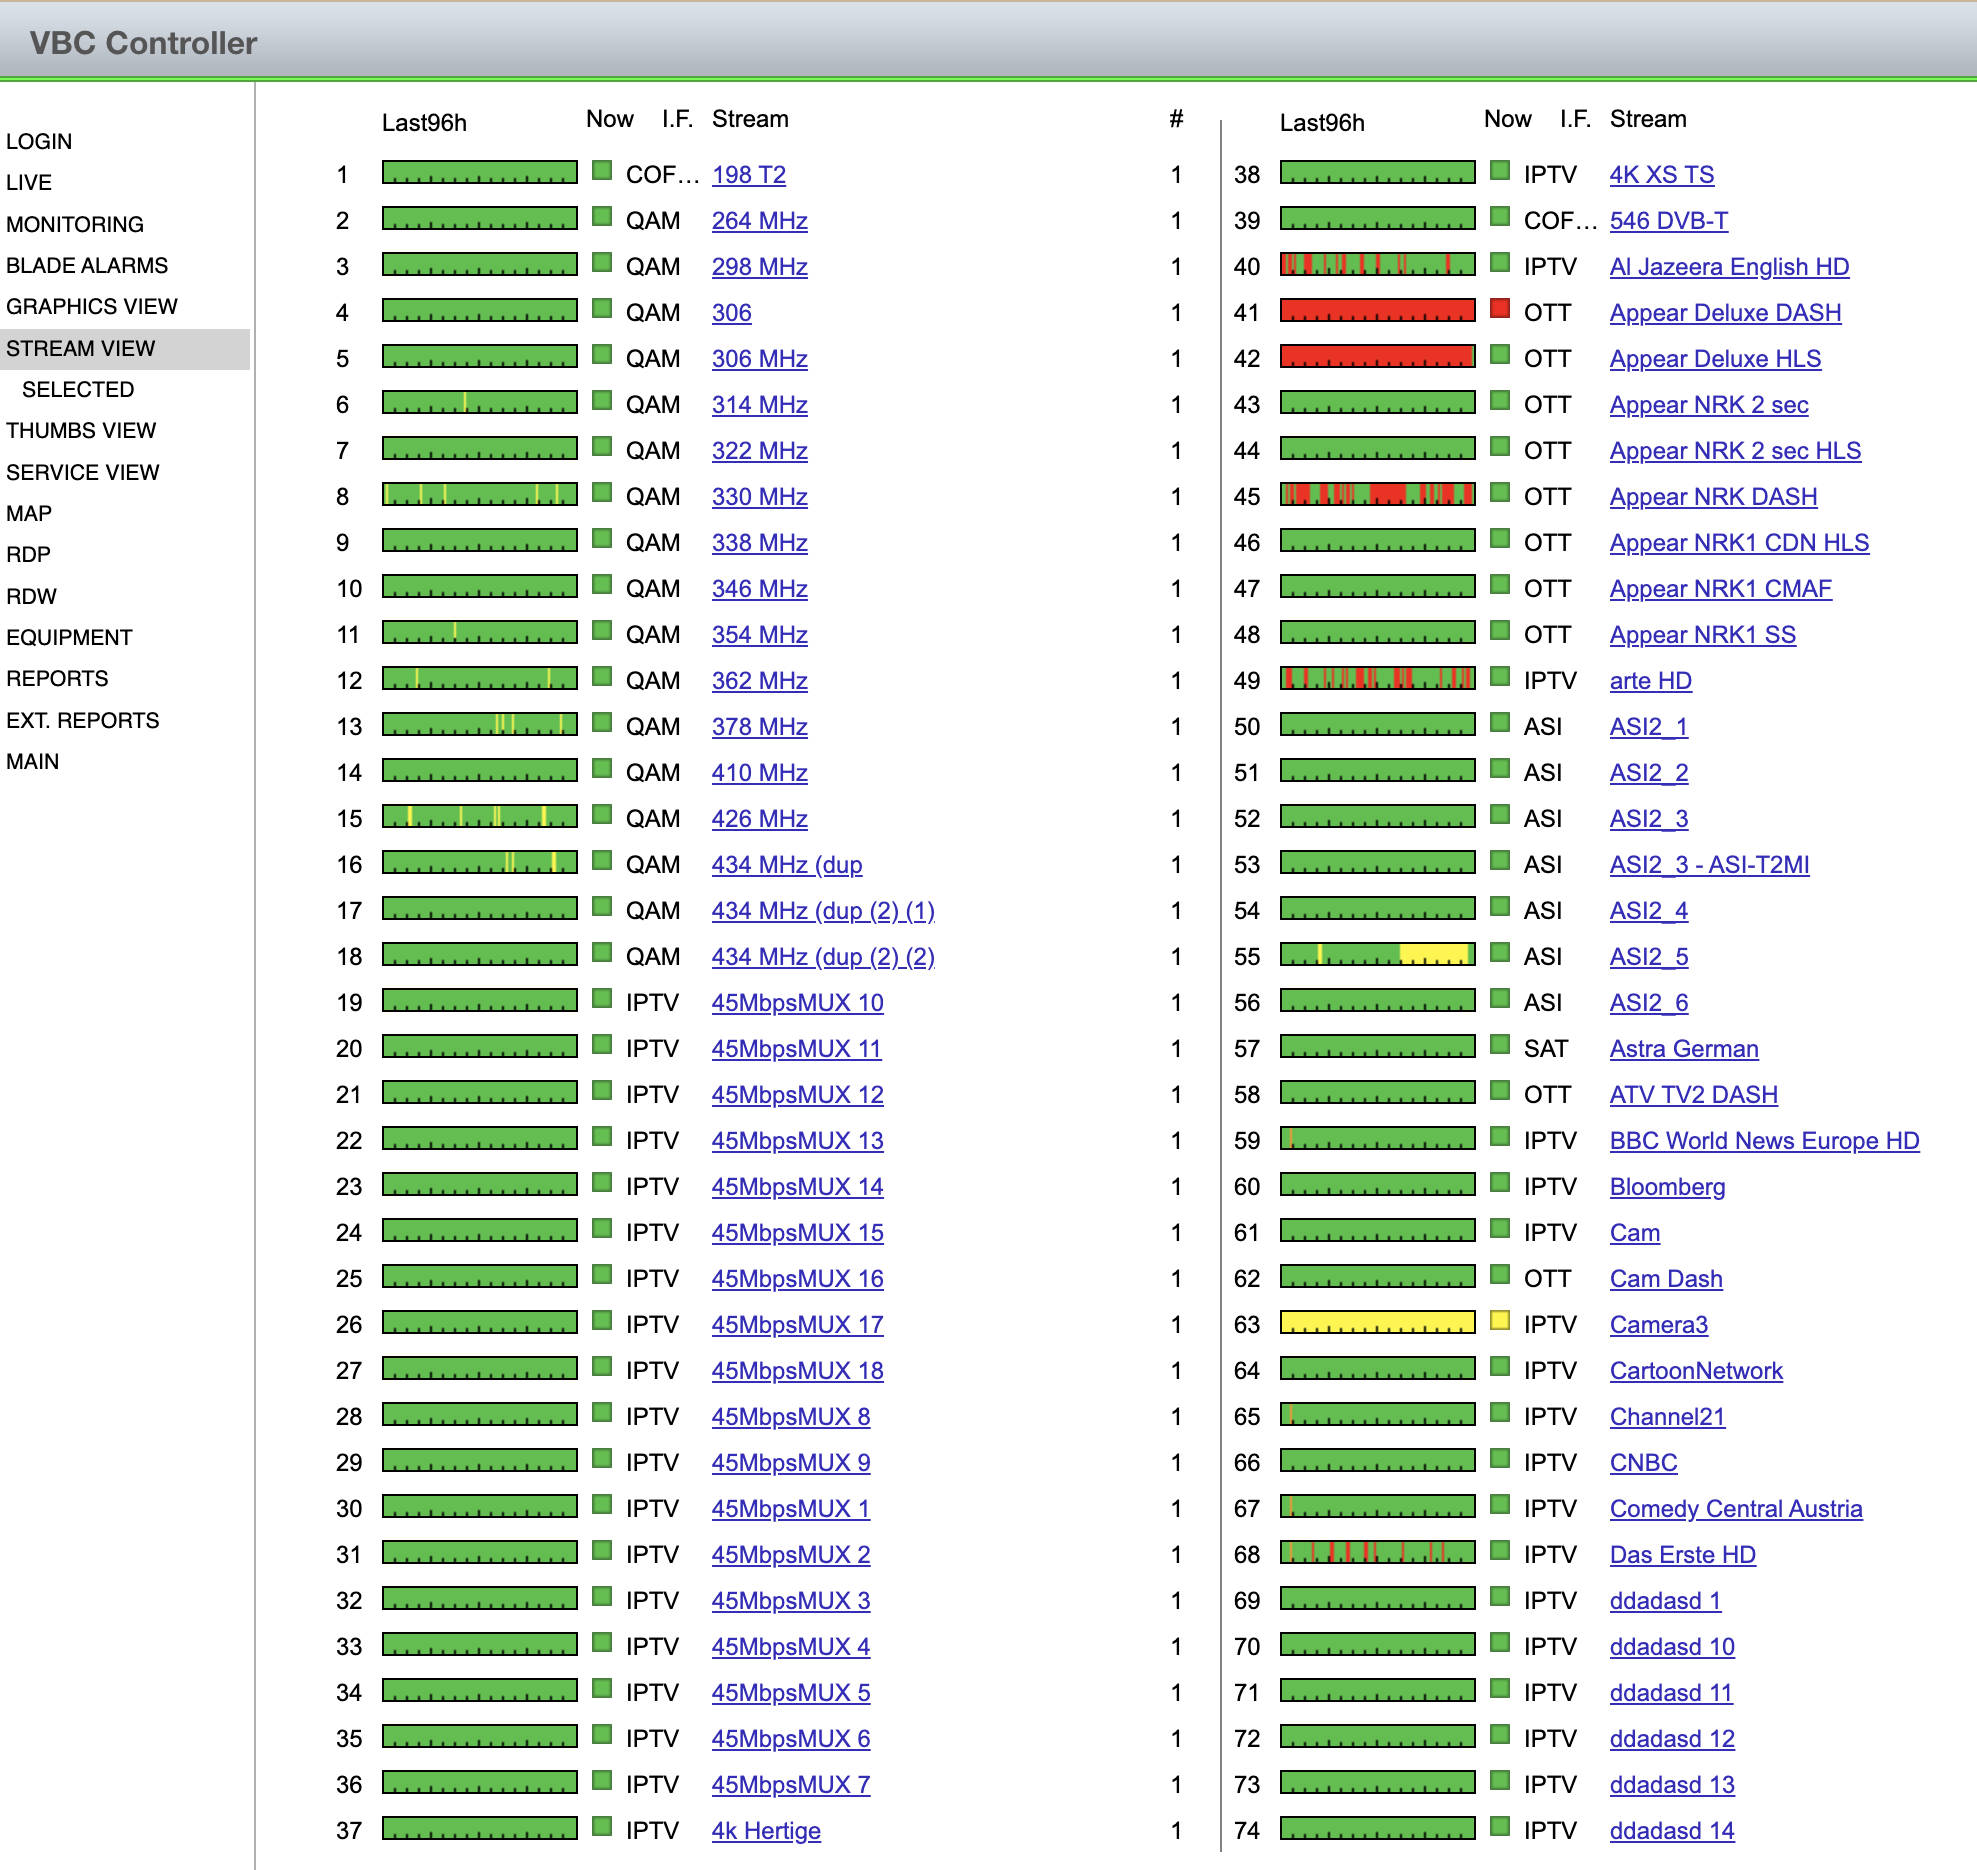
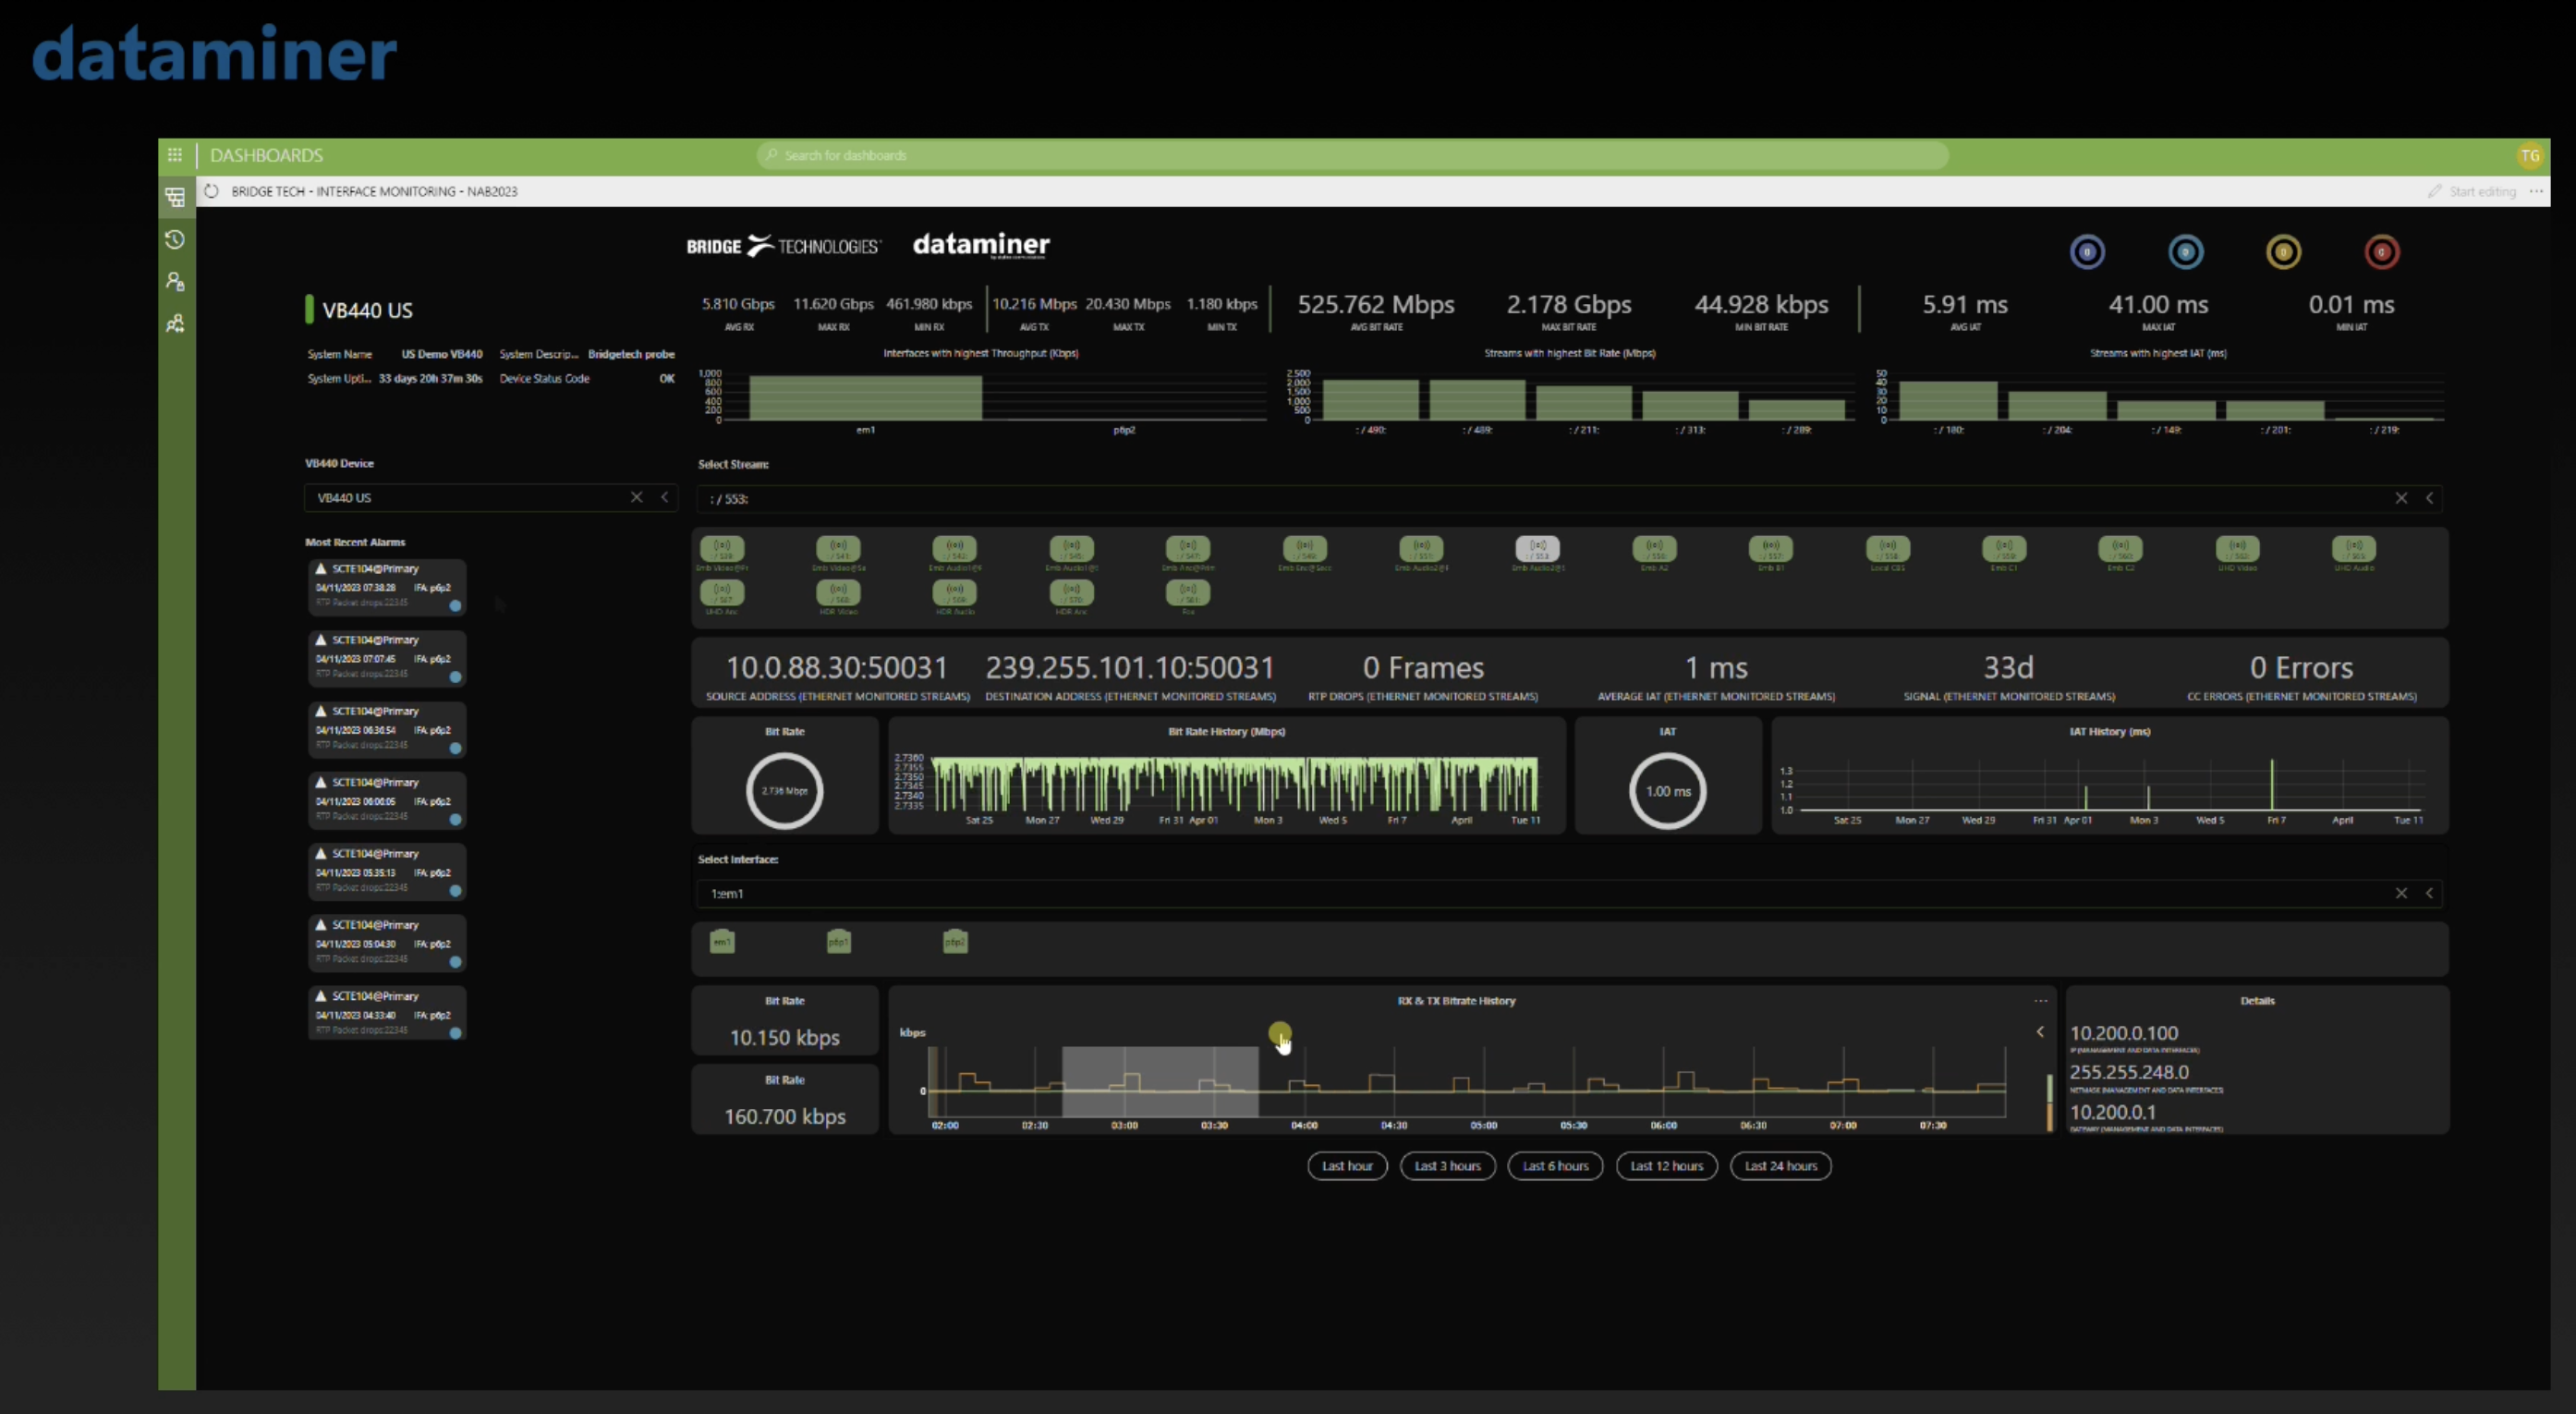
- MICROTIMELINE™ view of last 96 hours of operation for individual streams and configurable stream groups
- MICROTIMELINE™ stream view allowing easy identification of worst-performers
- Option for QTT Manager for active and continuous OTT monitoring
- Graphical timeline view for several days for comparison between sites
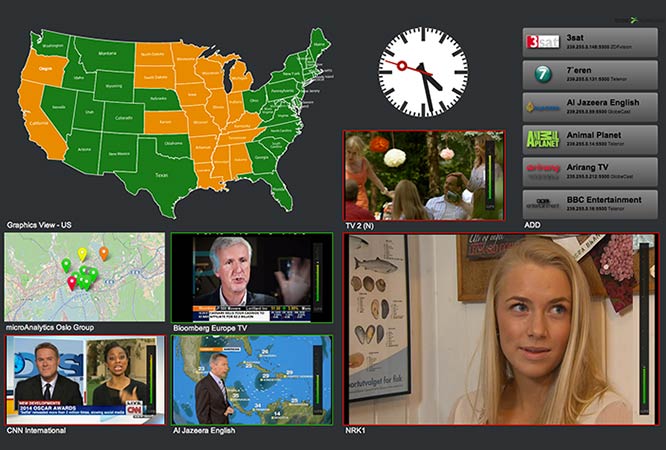
Centralized Monitor Wall
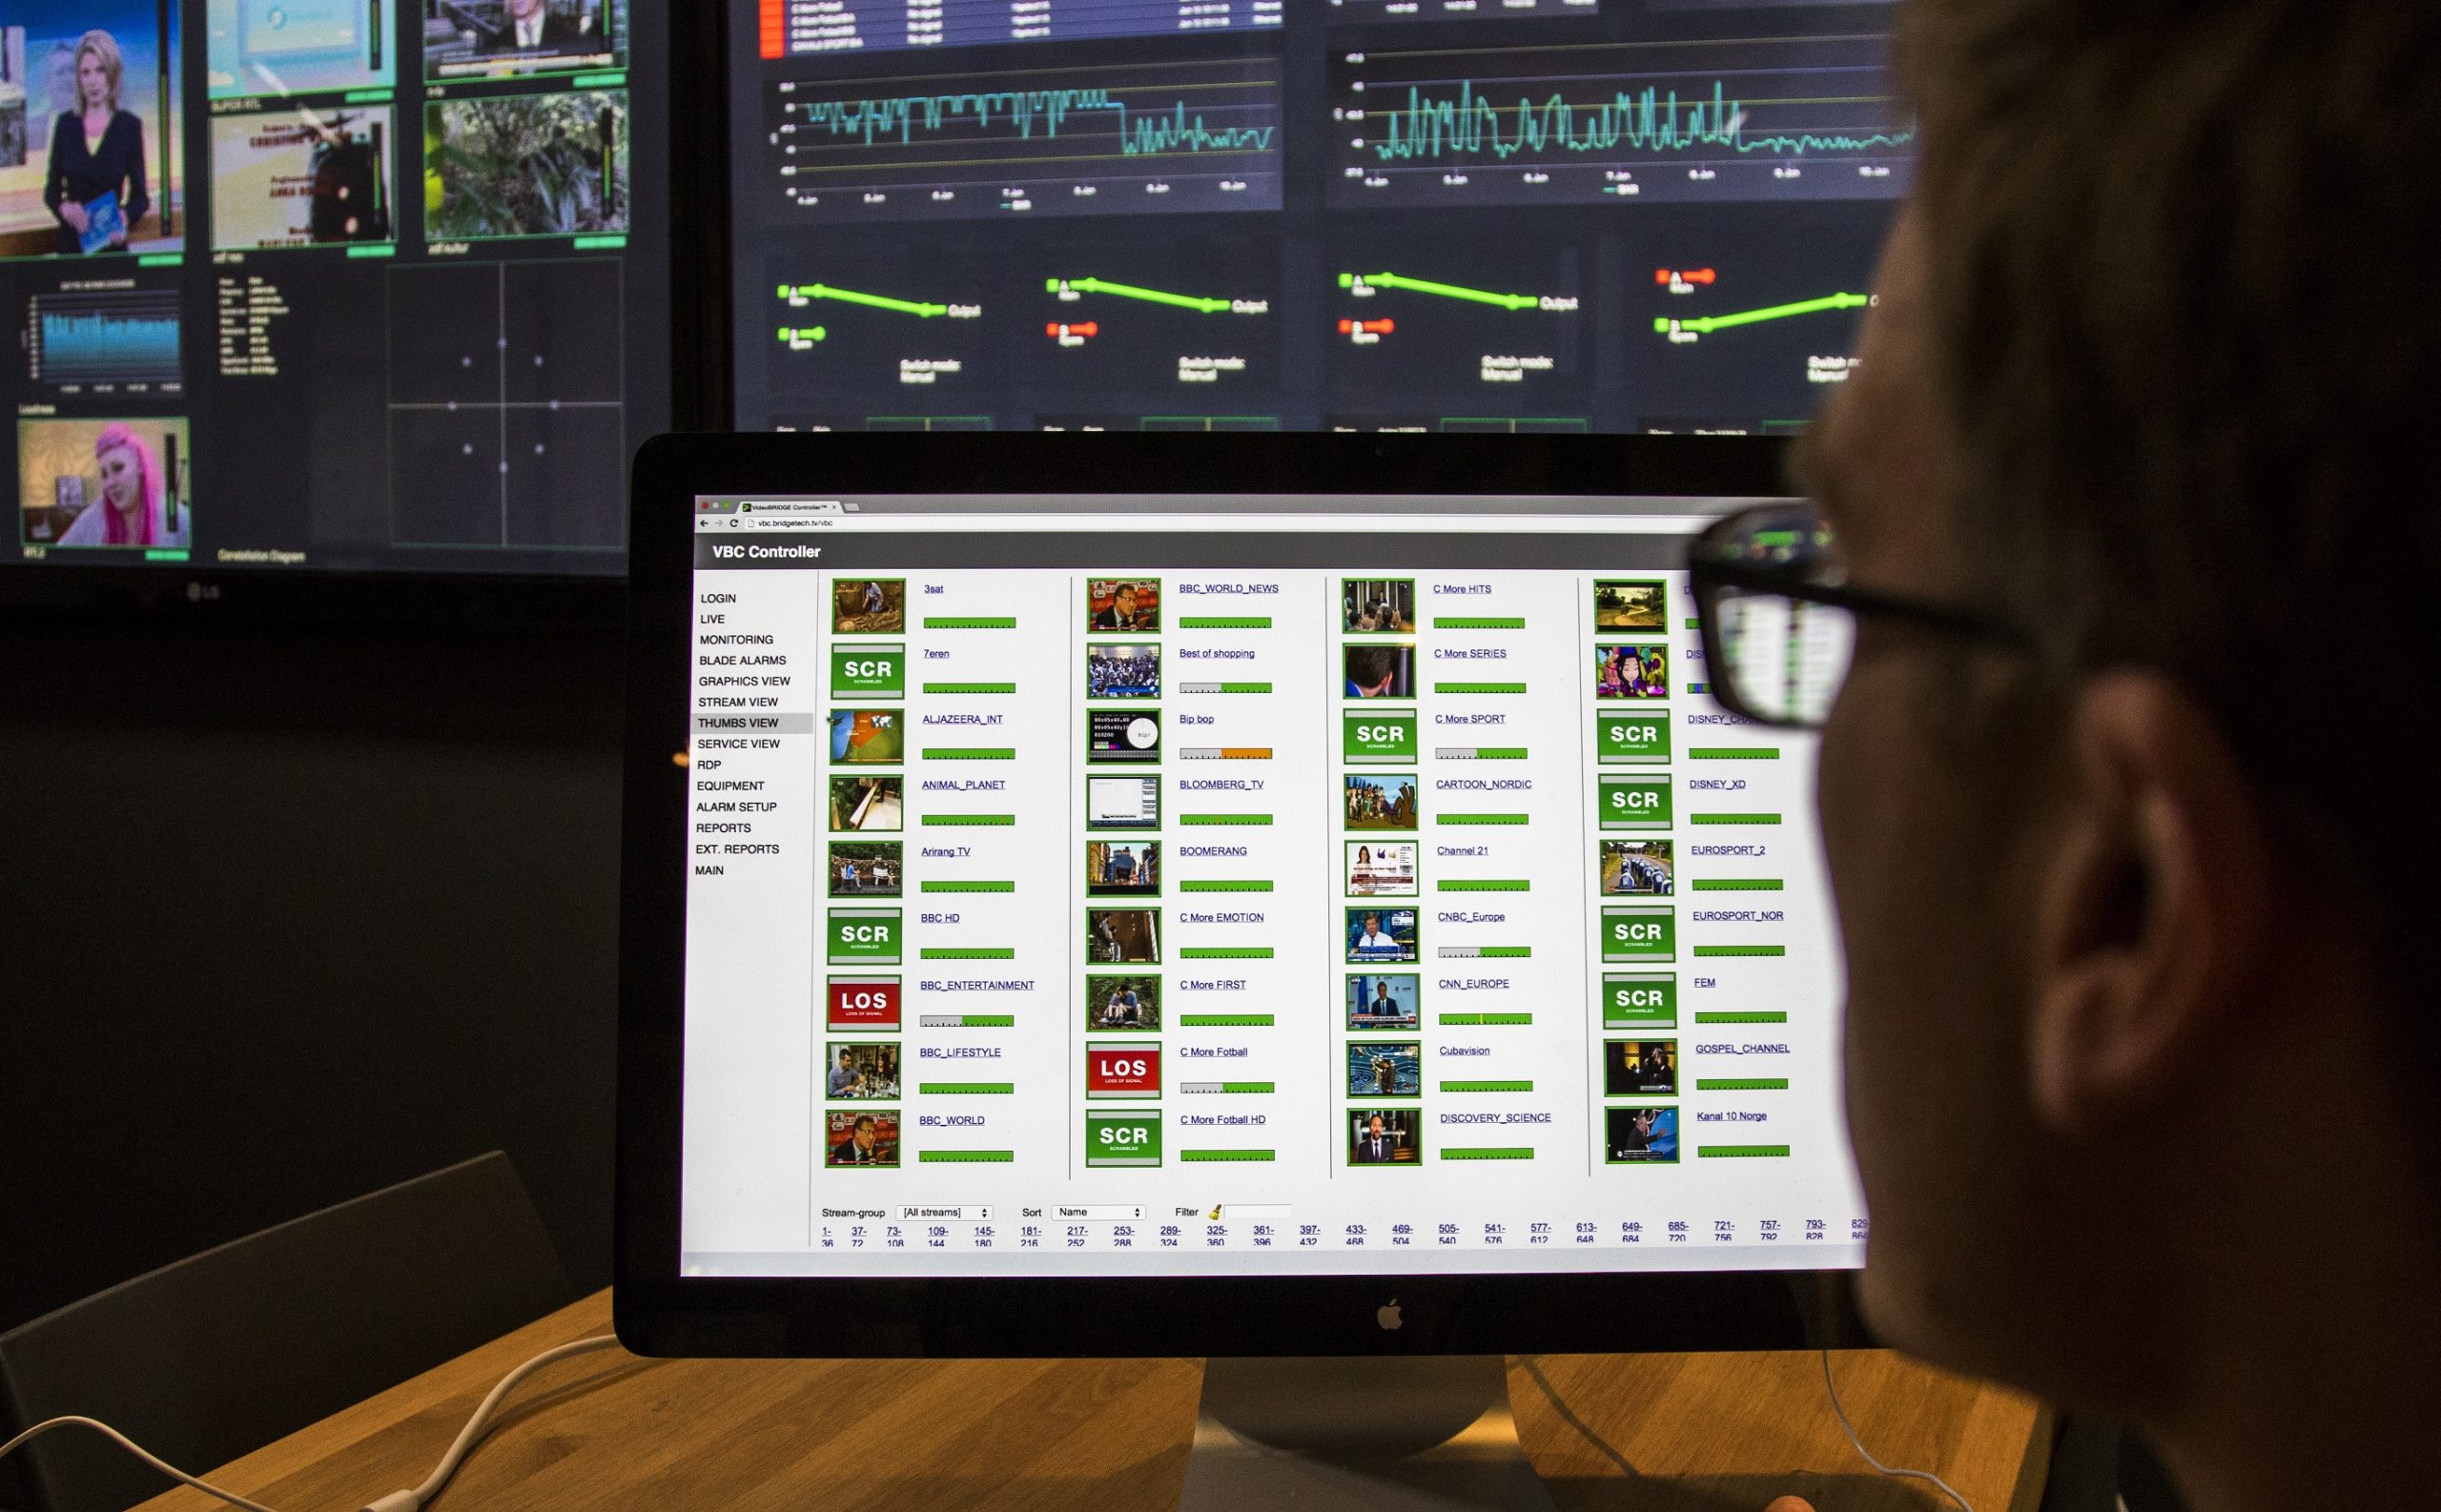
- Thumbnail view of all streams monitored by probes
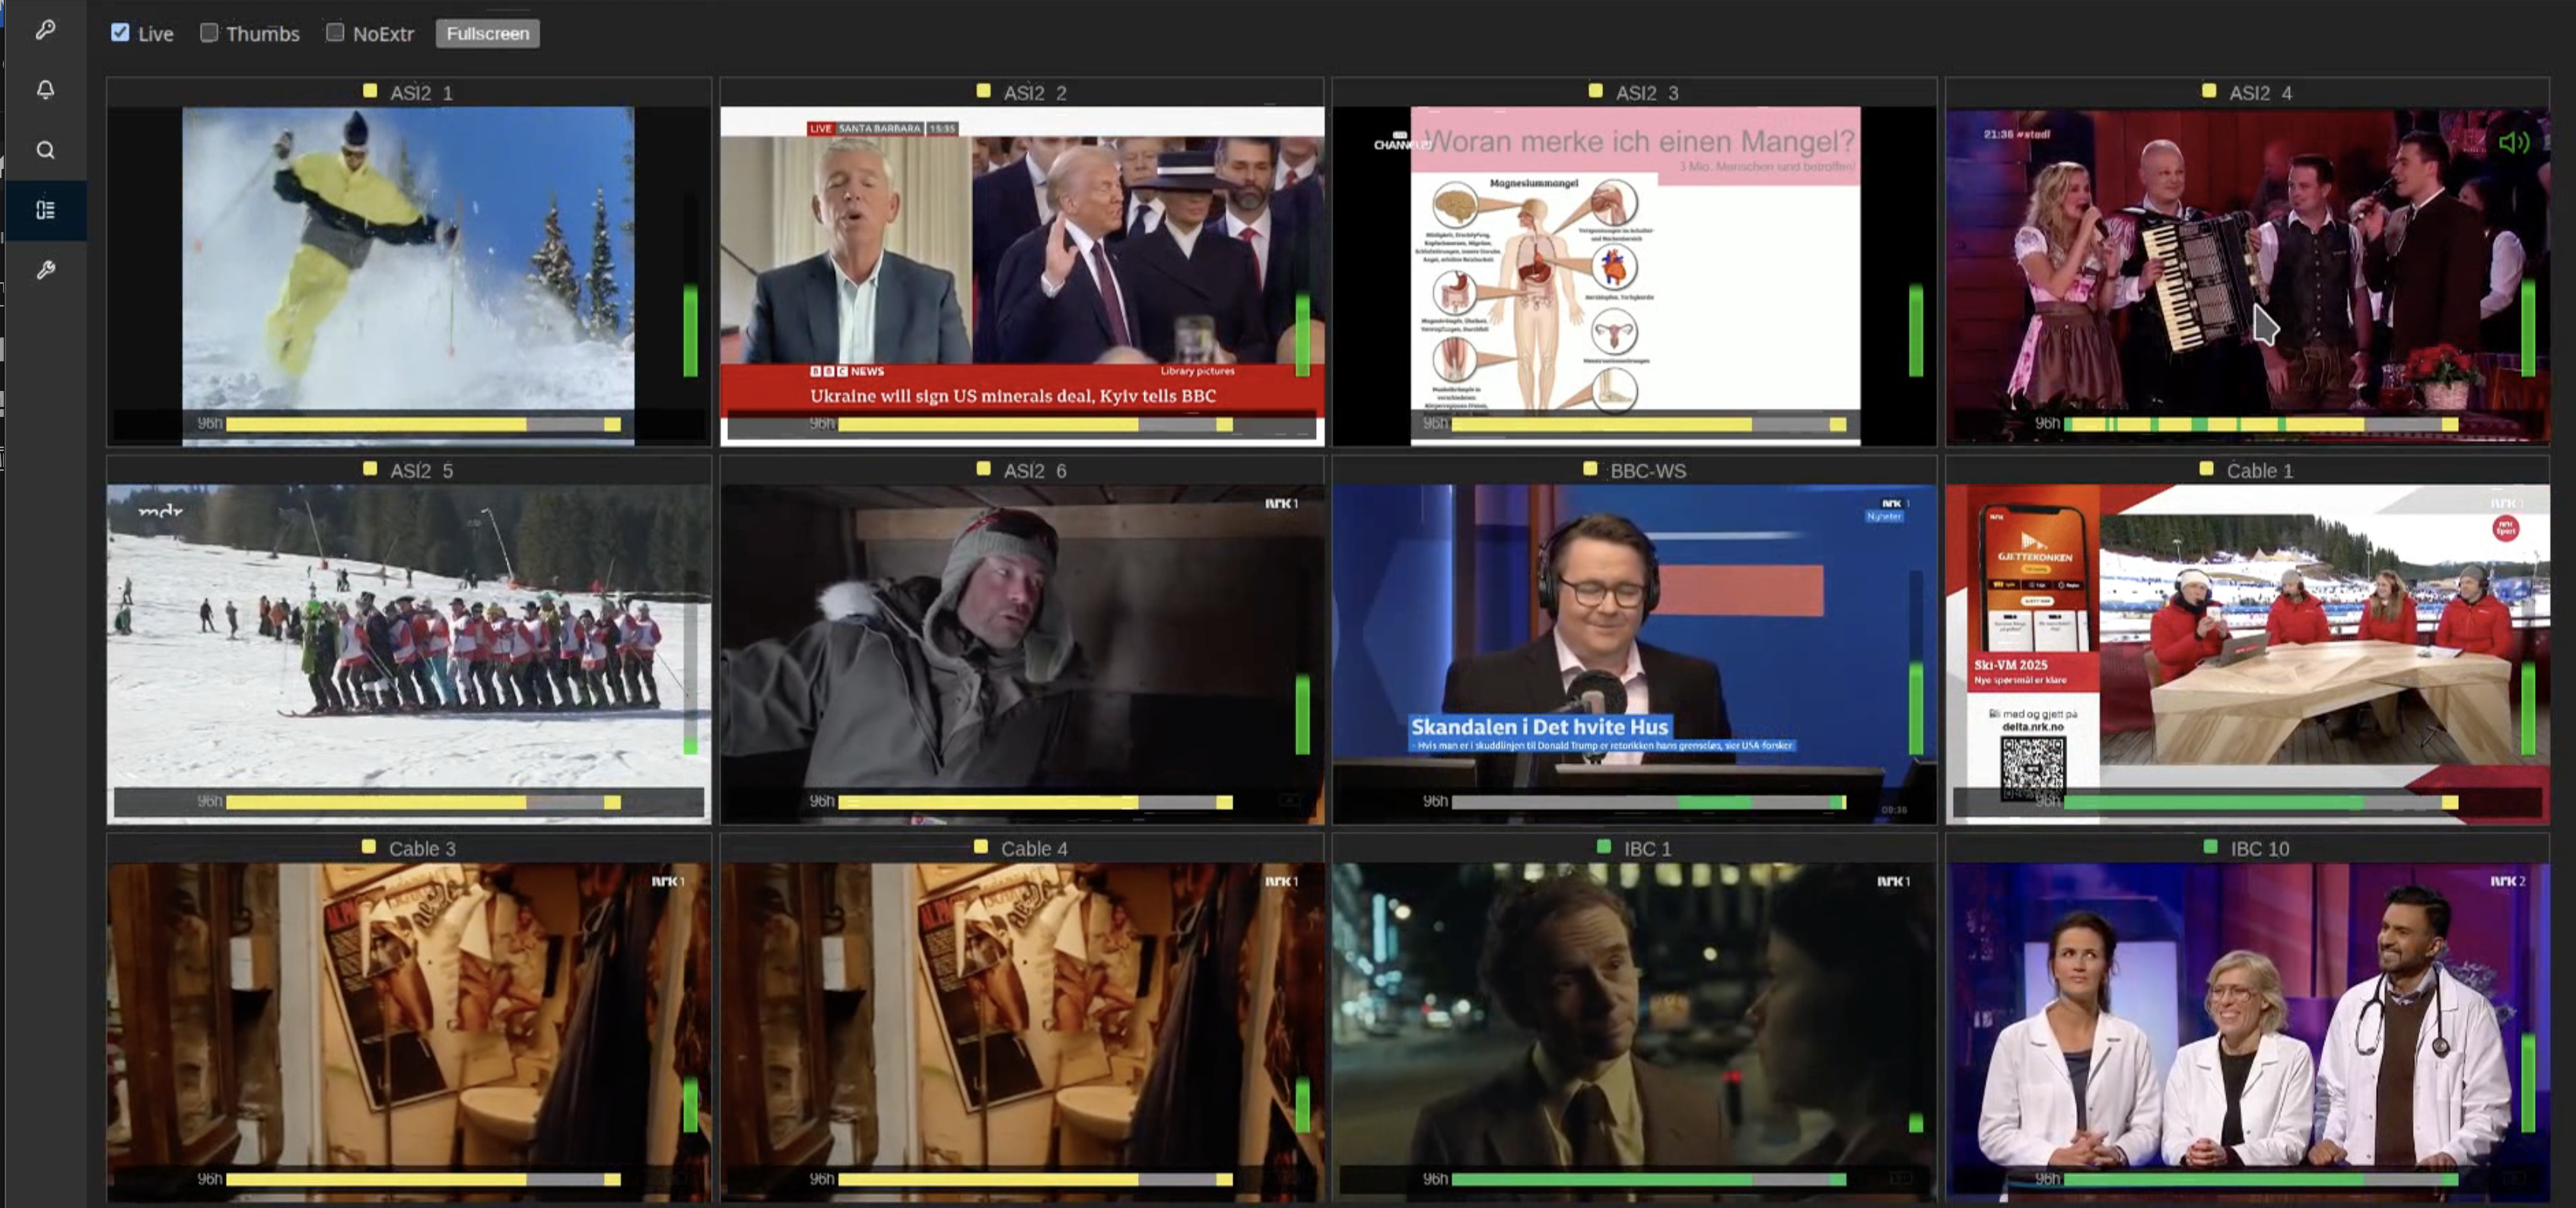
- Live decode view of up to 20 streams monitored locally by VBC through VBC-LIVE-OPT
- Live decode view of up to 2 streams monitored by a probe and relayed to VBC
- Audio listening option for live decoded streams
- Penalty box feature by sorting on streams with most severe alarms
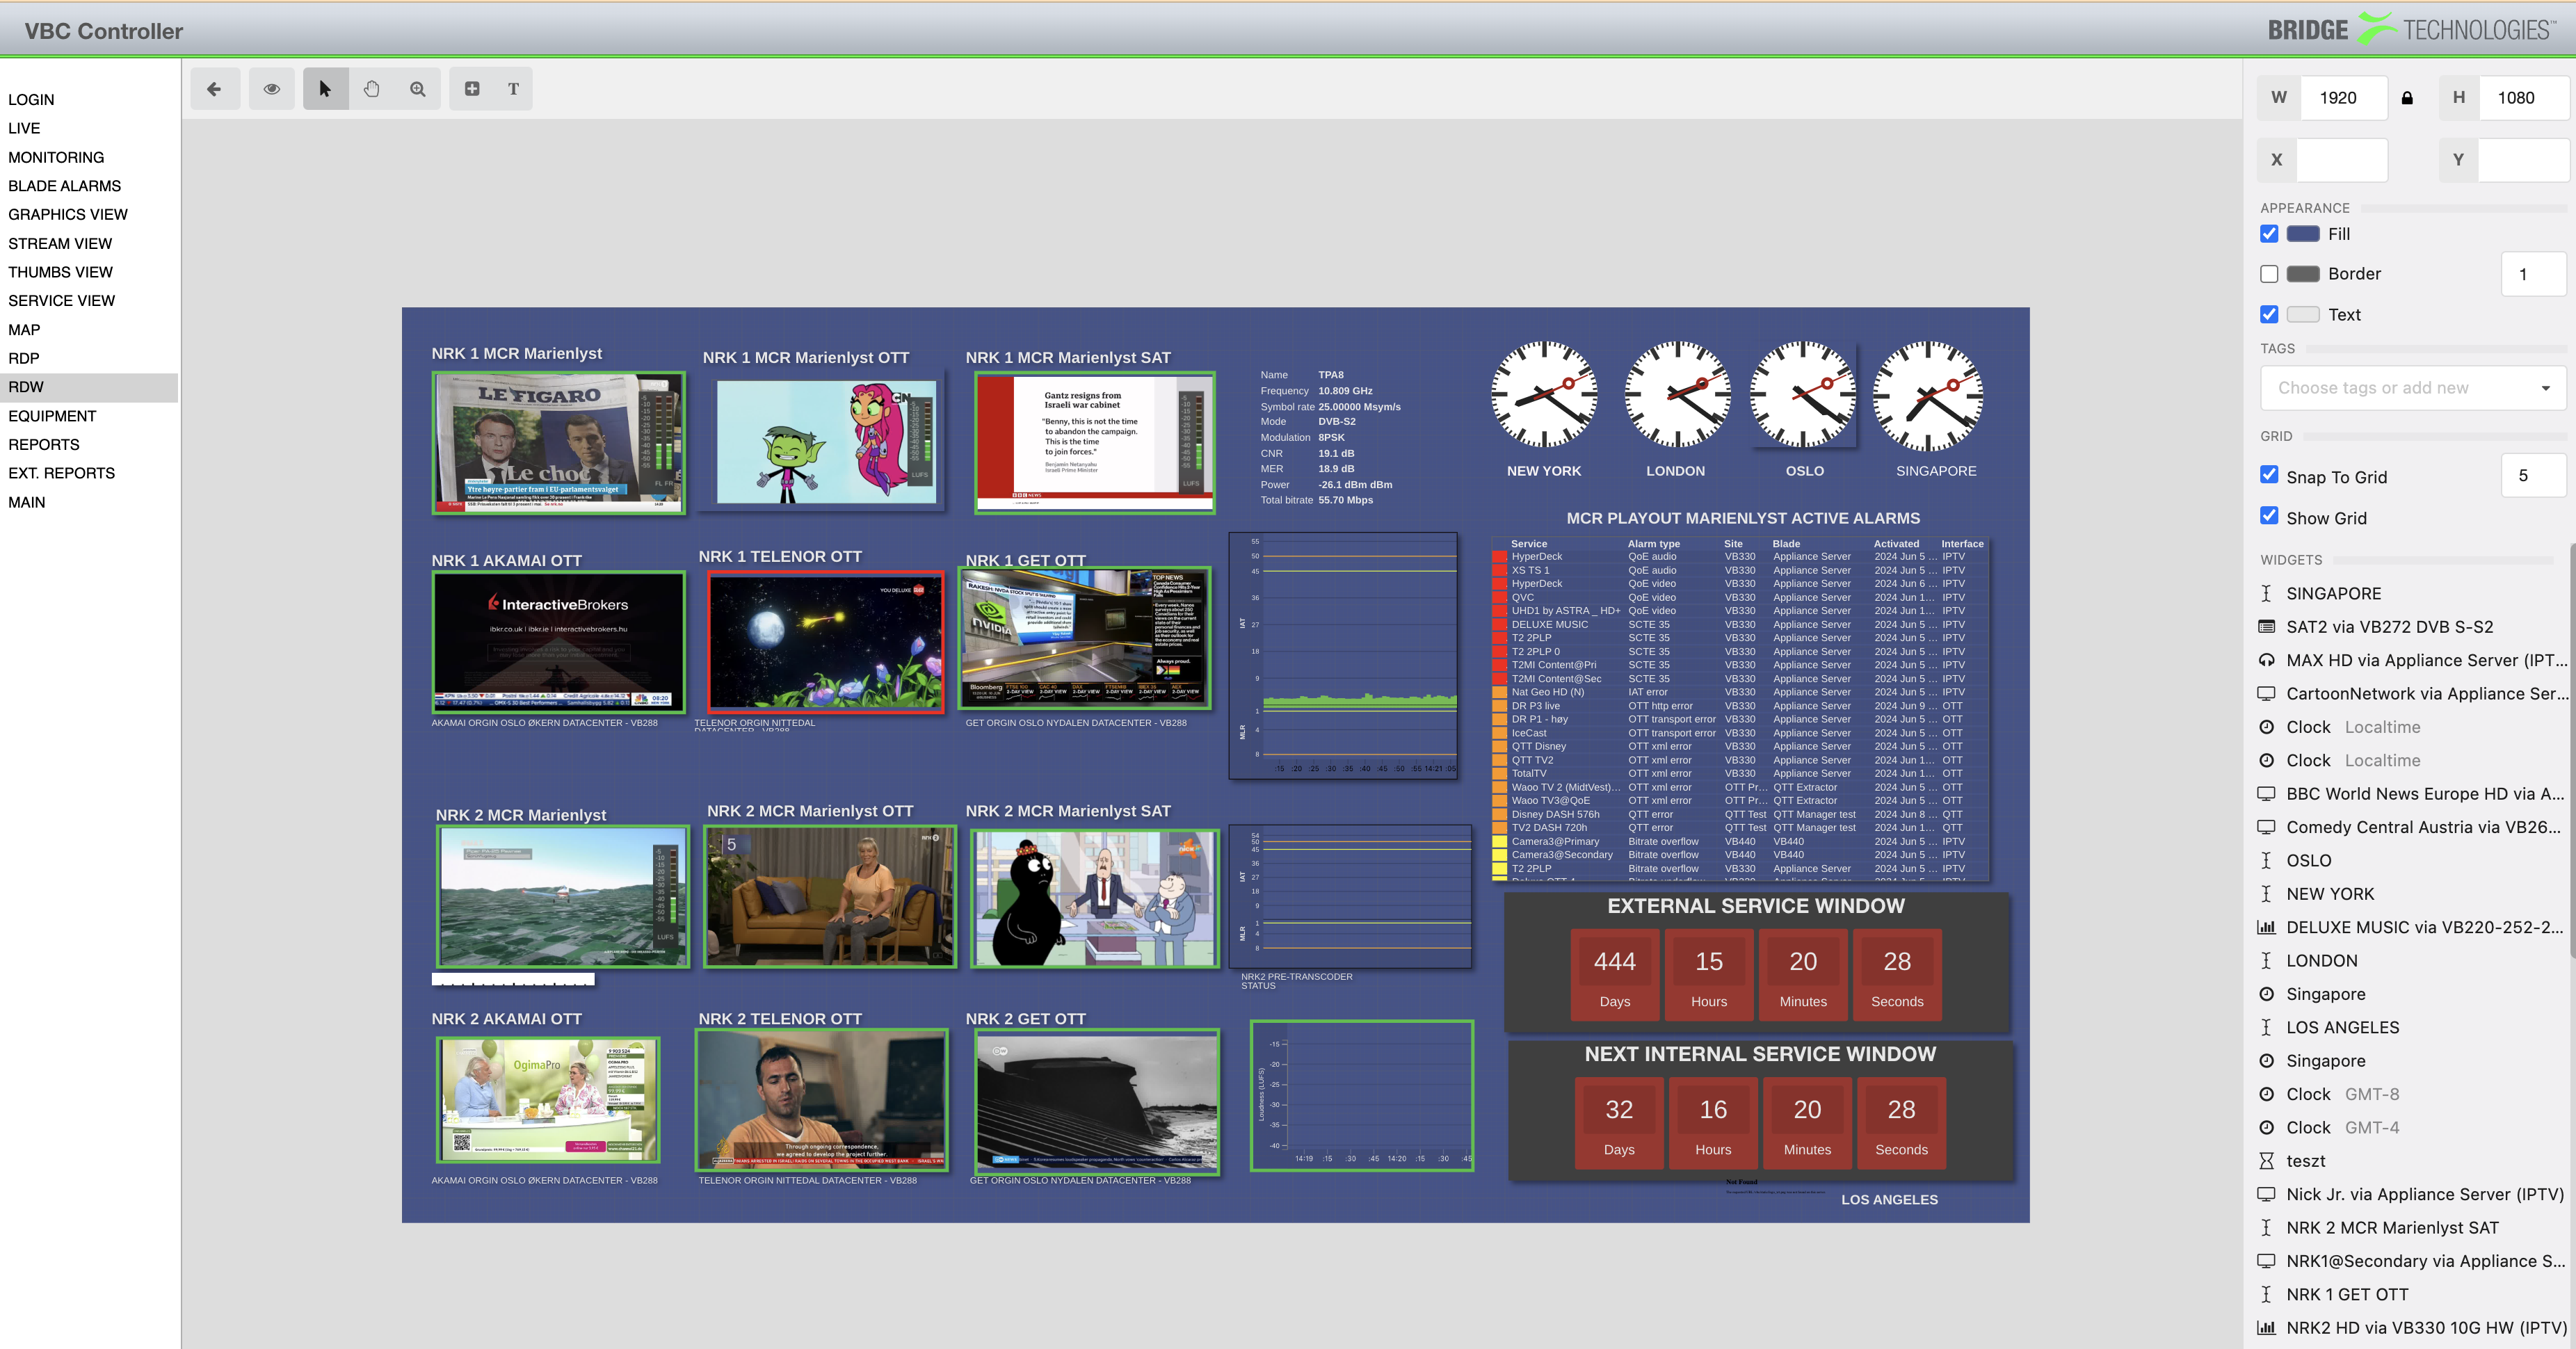
Remote Data Wall
- Create user specific Canvas view of widgets
- Loudness, Thumbnails, Alarms, RF Graphs, Countdowns and more
Logging and Reporting
- Trend graphs over multiple days of OTT, IPTV and RF parameters
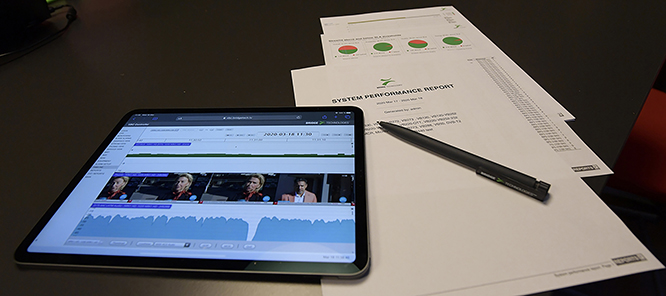
- Report generation as PDF and HTML
- Graphical timeline view for several days for comparison between sites
- Graphical Transport Stream aggregated alarm view for several days
- Alarm logging with readout as HTML or XML
Remote control and API
- Easy integration and data export for 3rd party NMS systems through XML
- SMNP traps and e-mail notification of alarm
Deployment
- Software only, on prem and cloud
- Linux, Ubuntu